UNITED STATES
SECURITIES AND EXCHANGE COMMISSION
Washington, D.C. 20549
FORM 10-K
(Mark One)
|
| | |
| ☒ | ANNUAL REPORT PURSUANT TO SECTION 13 OR 15(d) |
OF THE SECURITIES EXCHANGE ACT OF 1934
For the fiscal year ended August 31, 2016
OR
|
| | |
| ☐ | TRANSITION REPORT PURSUANT TO SECTION 13 OR 15(d) |
OF THE SECURITIES EXCHANGE ACT OF 1934
For the Transition period from to to
Commission File No. 1-11288
ACTUANT CORPORATION
(Exact name of Registrant as specified in its charter)
|
| | |
Wisconsin | | 39-0168610 |
(State or other jurisdiction of incorporation or organization) | | (I.R.S. Employer Identification No.) |
N86 W12500 WESTBROOK CROSSING
MENOMONEE FALLS, WISCONSIN 53051
Mailing address: P.O. Box 3241, Milwaukee, Wisconsin 53201
(Address of principal executive offices)
(262) 293-1500
(Registrant’s telephone number, including area code)
Securities registered pursuant to Section 12(b) of the Act:
|
| | | | | |
| (Title of each class) | | (Name of each exchange on which registered) | |
| Class A Common Stock, par value $0.20 per share | | New York Stock Exchange | |
Securities registered pursuant to Section 12(g) of the Act: None
Indicate by checkmark if the registrant is a well-known seasoned issuer, as defined in Rule 405 of the Securities Act. Yes ☒ No ☐
Indicate by check mark if the registrant is not required to file reports pursuant to Section 13 or Section 15d of the Act. Yes ☐ No ☒
Indicate by check mark whether the Registrant (1) has filed all reports required to be filed by Section 13 or 15(d) of the Securities Exchange Act of 1934 during the preceding 12 months, and (2) has been subject to such filing requirements for the past 90 days. Yes ☒ No ☐
Indicate by check mark whether the registrant has submitted electronically and posted on its corporate Web site, if any, every Interactive Data File required to be submitted and posted pursuant to Rule 405 of Regulation S-T (§232.405 of this chapter) during the preceding 12 months (or for such shorter period that the registrant was required to submit and post such files). Yes ☒ No ☐
Indicate by check mark if disclosure of delinquent filers pursuant to Item 405 of Regulation S-K is not contained herein, and will not be contained, to the best of Registrant’s knowledge, in definitive proxy or information statements incorporated by reference in Part III of this Form 10-K or any amendment to this Form 10-K. ☒
Indicate by check mark whether the registrant is a large accelerated filer, an accelerated filer, a non-accelerated filer or a smaller reporting company. See definition of “large accelerated filer,” “smaller reporting company” in Rule 12b-2 of the Exchange Act. (Check one):
|
| | | | |
Large accelerated filer | ☒
| | Accelerated filer | ☐
|
Non-accelerated filer | ☐
| | Smaller-reporting company | ☐
|
(do not check if a smaller reporting company) | | | | |
Indicate by check mark whether the registrant is a shell company (as defined in Rule 12b-2 of the Exchange Act.): Yes ☐ No ☒
There were 58,960,716 shares of the Registrant’s Class A Common Stock outstanding as of September 30, 2016. The aggregate market value of the shares of Common Stock (based upon the closing price on the New York Stock Exchange on February 29, 2016) held by non-affiliates of the Registrant was approximately $1.36 billion.
DOCUMENTS INCORPORATED BY REFERENCE
Portions of the definitive Proxy Statement for the Annual Meeting of Shareholders to be held on January 17, 2017 are incorporated by reference into Part III hereof.
TABLE OF CONTENTS
|
| | |
| | |
| | |
| | |
Item 1. | | |
Item 1A. | | |
Item 1B. | | |
Item 2. | | |
Item 3. | | |
Item 4. | | |
| | |
| | |
| | |
Item 5. | | |
Item 6. | | |
Item 7. | | |
Item 7A. | | |
Item 8. | | |
Item 9. | | |
Item 9A. | | |
Item 9B. | | |
| | |
| | |
| | |
Item 10. | | |
Item 11. | | |
Item 12. | | |
Item 13. | | |
Item 14. | | |
| | |
| | |
| | |
Item 15. | | |
Actuant Corporation provides free-of-charge access to our annual report on Form 10-K, quarterly reports on Form 10-Q, current reports on Form 8-K, and all amendments thereto, through our website, www.actuant.com, as soon as reasonably practical after such reports are electronically filed with the Securities and Exchange Commission.
FORWARD LOOKING STATEMENTS AND CAUTIONARY FACTORS
This annual report on Form 10-K contains certain statements that constitute forward-looking statements within the meaning of the Private Securities Litigation Reform Act of 1995 that involve risks and uncertainties. The terms “may,” “should,” “could,” “anticipate,” “believe,” “estimate,” “expect,” “objective,” “plan,” “project” and similar expressions are intended to identify forward-looking statements. Such forward-looking statements are subject to inherent risks and uncertainties that may cause actual results or events to differ materially from those contemplated by such forward-looking statements. In addition to the assumptions and other factors referred to specifically in connection with such statements, factors that may cause actual results or events to differ materially from those contemplated by such forward-looking statements include, without limitation, general economic uncertainty, market conditions in the industrial, oil & gas, energy, power generation, infrastructure, commercial construction, truck, automotive, specialty vehicle and agriculture industries, market acceptance of existing and new products, successful integration of acquisitions and related restructuring, operating margin risk due to competitive pricing and operating efficiencies, supply chain risk, material, labor, or overhead cost increases, foreign currency risk, interest rate risk, commodity risk, the impact of geopolitical activity, litigation matters, impairment of goodwill or other intangible assets, the Company’s ability to access capital markets and other factors that may be referred to or noted in the Company’s reports filed with the Securities and Exchange Commission from time to time, including those described under "Item 1A. Risk Factors" of this annual report on Form 10-K. We disclaim any obligation to publicly update or revise any forward-looking statements as a result of new information, future events or any other reason.
When used herein, the terms “Actuant,” “we,” “us,” “our,” and the “Company” refer to Actuant Corporation and its subsidiaries.
PART I
Item 1. Business
General
Actuant Corporation, headquartered in Menomonee Falls, Wisconsin, is a Wisconsin corporation incorporated in 1910. We are a global diversified company that designs, manufactures and distributes a broad range of industrial products and systems to various end markets. The Company is organized into three operating segments: Industrial, Energy and Engineered Solutions. The Industrial segment is primarily involved in the design, manufacture and distribution of branded hydraulic and mechanical tools to the maintenance, industrial, infrastructure and production automation markets. The Energy segment provides joint integrity products and services, customized offshore vessel mooring solutions, as well as rope and cable solutions to the global oil & gas, power generation and other markets. The Engineered Solutions segment provides highly engineered position and motion control systems to original equipment manufacturers (“OEM”) in various on and off-highway vehicle markets, as well as a variety of other products to the industrial and agricultural markets. Financial information related to the Company's segments is included in Note 13, "Business Segment, Geographic and Customer Information" in the notes to the consolidated financial statements.
Our business model, illustrated below, emphasizes cash flow generation. The model starts with core sales growth, (sales growth excluding the impact of acquisitions, divestitures and foreign currency rate changes) through customer intimacy, new products and emerging market penetration. We further increase sales and profits through capital deployment in business acquisitions and capital expenditures. The acquisitions add new capabilities, technologies, customers and geographic presence to make our businesses stronger. Operational excellence processes including effective product sourcing, lean manufacturing, acquisition integration and leadership development, along with other continuous improvement activities, are utilized to improve our businesses. When executed effectively, these actions generate strong earnings and cash flow, which we reinvest back into the business or return to shareholders via dividends and stock buybacks.
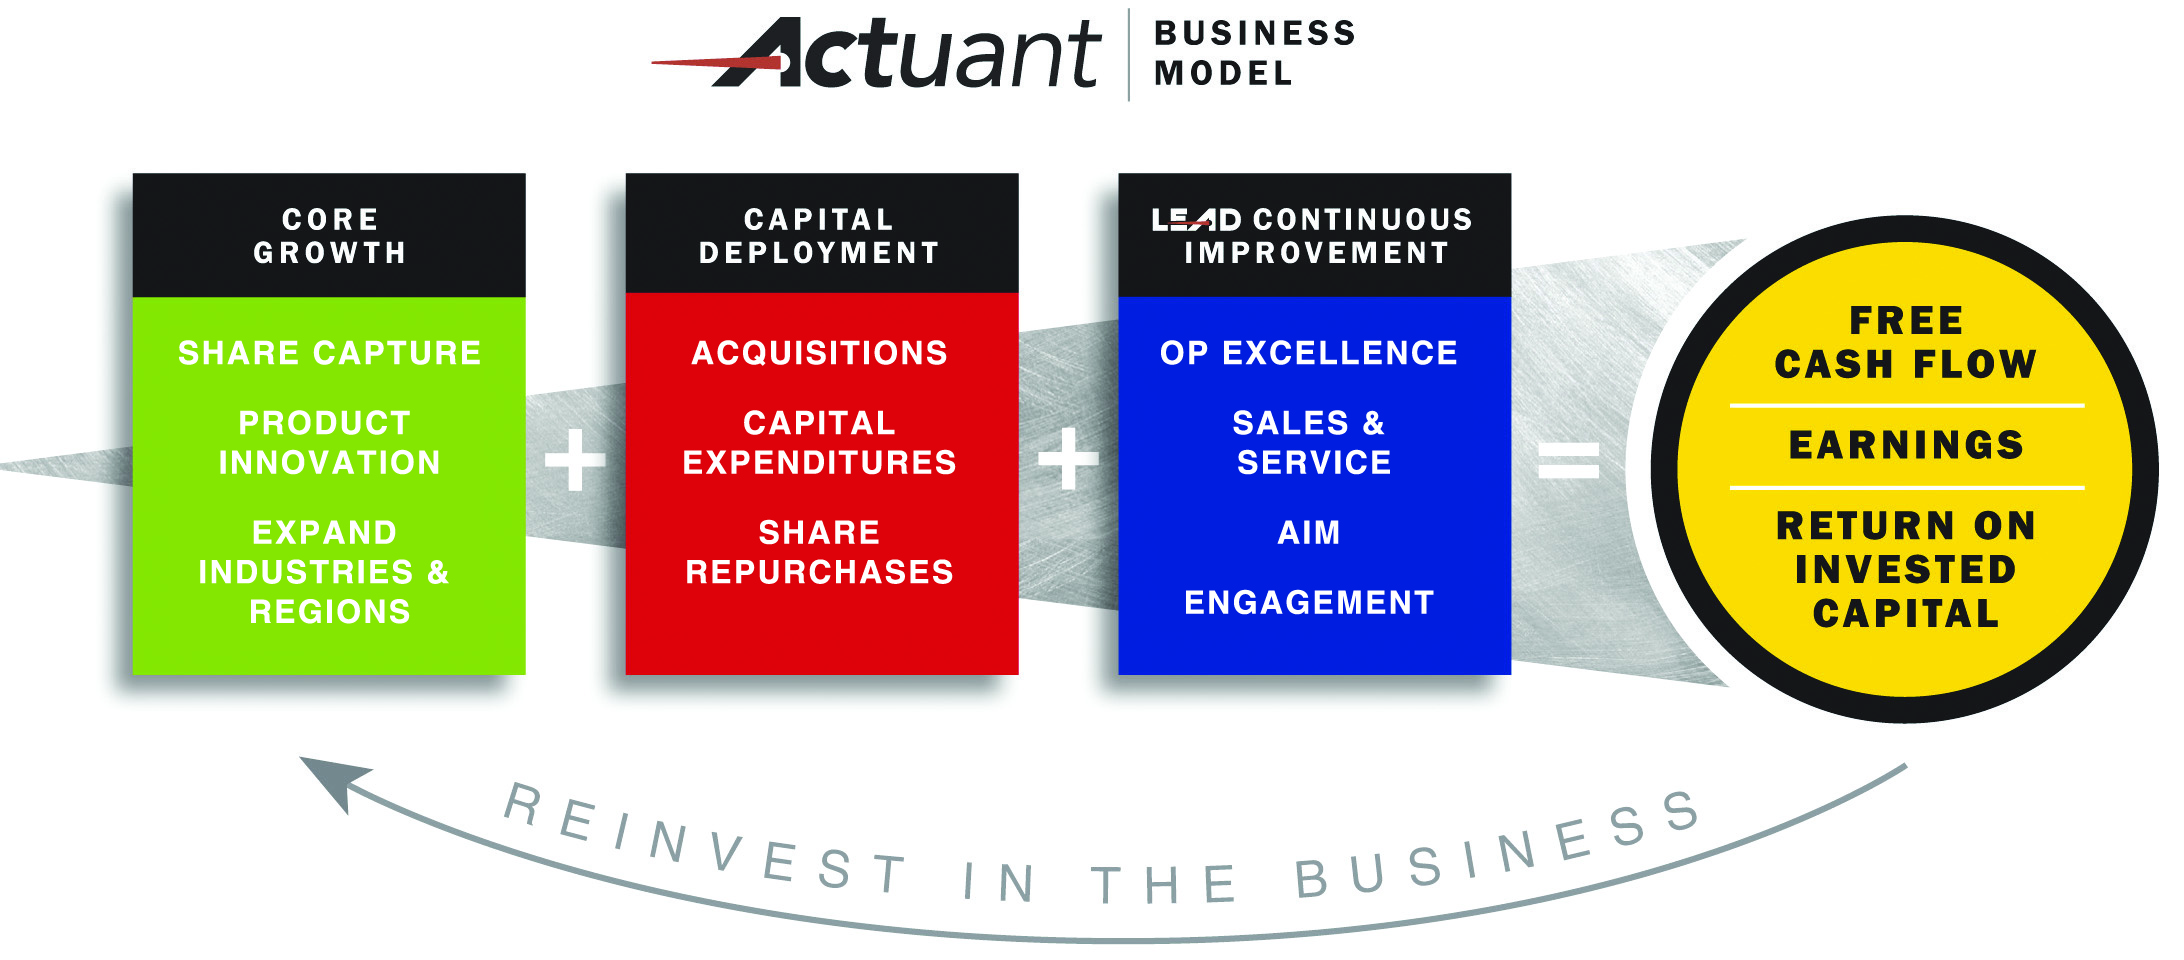
Our long-term goal is to grow diluted earnings per share faster than most multi-industry peers. We intend to leverage our strong market positions to generate core sales growth that exceeds end-market growth rates. Core sales growth is accomplished through a combination of share capture, product innovation and market expansion into emerging industries and geographic regions. In addition to core sales growth, we are focused on acquiring complementary businesses. Following an acquisition, we seek to drive growth opportunities (additional cross-selling opportunities and customer relationships) and cost reductions via operational excellence. We also focus on profit margin expansion and cash flow generation to achieve our financial objectives. Our LEAD (“Lean Enterprise Across Disciplines”) Business System utilizes various continuous improvement techniques to reduce costs, improve efficiencies and drive operational excellence across all locations and functions worldwide, thereby expanding profit margins. Strong cash flow generation is achieved by maximizing returns on assets and minimizing primary working capital needs. Our LEAD efforts also support our core sales growth. The cash flow that results from efficient asset management and improved profitability is used to fund strategic acquisitions, common stock repurchases and internal growth opportunities.
Our businesses provide an array of products and services across multiple end markets and geographies which results in significant diversification. The long-term sales growth and profitability of our business is dependent not only on increased demand in end markets and the overall economic environment, but also on our ability to identify, consummate and integrate strategic acquisitions, develop and market innovative new products, expand our business activity geographically and continuously improve operational excellence. Despite current challenges from weak end market demand, we remain focused on maintaining our financial position and flexibility by adjusting our cost structure to reflect changes in demand levels and by proactively managing working capital and cash flow generation.
Description of Business Segments
Industrial
The Industrial segment is a leading global supplier of branded hydraulic and mechanical tools to a broad array of end markets, including the general maintenance and repair, industrial, energy, mining, infrastructure and production automation markets. Its primary products include high-force hydraulic tools, highly engineered heavy lifting solutions, workholding (production automation) solutions and concrete stressing components and systems. Our hydraulic and mechanical tools are marketed primarily through the Enerpac, Simplex, Precision-Hayes, Milwaukee Cylinder and Larzep brand names.
Our Industrial Tools product line includes high-force hydraulic and mechanical tools (cylinders, pumps, valves, specialty tools and presses), which are designed to allow users to apply controlled force and motion to increase productivity, reduce labor costs and make work safer and easier to perform. These hydraulic tools operate at very high pressures of approximately 5,000 to 12,000 pounds per square inch and are generally sold by a diverse group of industrial and specialty fluid power distributors to customers in the infrastructure, mining, steel mill, cement, rail, oil & gas, power generation and general maintenance industries. Examples of industrial distributors include W.W. Grainger, Applied Industrial Technologies, MSC, Blackwoods and Industrial Air Tool.
We have leveraged production and engineering capabilities to also offer a broad range of workholding products (work supports, swing cylinders and system components) that are marketed through distributors to the automotive, machine tool and fixture design markets. In addition, we design, manufacture and distribute concrete tensioning products (chucks and wedges,
stressing jacks and anchors), which are used by concrete tensioning system designers, fabricators and installers for the residential and commercial construction, bridge, infrastructure and mining markets.
In addition to providing a comprehensive line of industrial tools, the segment also provides high-force hydraulic systems (Integrated Solutions) to meet customer-specific requirements for safe and precise control of heavy lifting solutions. These solutions, many of which are customized, combine hydraulics, fabricated structures and electronic controls with engineering and application knowledge, and are typically utilized in major industrial, infrastructure and power generation projects involving heavy lifting, launching and skidding or synchronous lifting applications. Our Integrated Solutions standard product offering includes hydraulic gantries, strand jacks and synchronous lift systems, among other products.
Energy
The Energy segment provides products and services to the global energy markets, where safety, reliability, up-time and productivity are key value drivers. Products include joint integrity tools, connectors for oil & gas and power generation installations, maintenance services and high performance ropes, cables and umbilicals. In addition to these products, the Energy segment also provides customized offshore vessel mooring solutions, joint integrity tools under rental arrangements, technical manpower solutions, as well as rope and cable solutions to the global oil & gas, power generation and energy markets. The products and services of the Energy segment are distributed and marketed under various brand names (principally Hydratight, Cortland and Viking) to OEMs, maintenance and service organizations and energy producers in emerging and developed countries.
Our Energy Maintenance & Integrity product line provides joint integrity products including hydraulic torque wrenches, bolt tensioners, portable machining equipment and subsea connectors, which are either sold or rented to asset owners, service providers and end users. These products are used in the maintenance of bolted joints on oil rigs and platforms, wind turbines, refineries and pipelines, petrochemical installations, as well as fossil fuel and nuclear power plants to reduce customer downtime and provide increased safety and reliability. Hydratight also provides manpower services where our highly trained technicians perform bolting, machining, pipeline precommissioning and joint integrity work for customers. Our joint integrity business operates to world class safety standards while delivering products and services through a localized infrastructure of rental and maintenance depots. Joint integrity sales consist of technical manpower services, product sales and rental revenue. This business maintains strong relationships with a variety of customers such as Bechtel, Chevron, Subsea 7 and British Petroleum (BP).
Our Other Energy Solutions product line, which includes our Cortland and Viking businesses, provides customized rope and cable solutions as well as marine mooring solutions. Cortland develops highly-engineered rope, umbilical and cable solutions that maximize performance, safety and efficiency for customers in various markets including oil & gas, heavy marine, diving and remote operating vehicle ("ROV"). With its global design and manufacturing capabilities, this business is able to provide customized synthetic ropes, heavy lift slings, specialized mooring, rigging and towing systems, electro-optical-mechanical cables and umbilicals to customers including Aker Solutions, FMC Technologies, Expro and Technip. These products are utilized in critical applications, often deployed in harsh operating conditions (including subsea oil & gas production, maintenance and exploration) and are required to meet robust safety standards. Additional custom designed products are also sold into a variety of other niche markets including mining, medical, security, aerospace and defense.
In addition, the Energy Segment also provides customers with a comprehensive range of marine mooring equipment and associated services (survey, inspection, design and installation) to meet the demands of offshore energy assets. Our Viking business delivers efficient and safe mooring solutions in the harshest environments to customers involved in offshore oil & gas exploration, drilling and floating production storage and offloading (FPSO) projects, offshore construction and renewable energy projects. These marine products (including chains, anchors, cables and fiber rope), innovative solutions and services increase customer uptime and ensure safe operations. Viking services customers globally, including Statoil, Chevron, Woodside Energy and BP.
Engineered Solutions
The Engineered Solutions segment is a leading global designer and assembler of customized position and motion control systems and other industrial products to various vehicle and other niche markets. The segment focuses on providing technical and highly engineered products, including actuation systems, mechanical power transmission products, engine air flow management systems, human to machine interface ("HMI") solutions and other rugged electronic instrumentation. Products in the Engineered Solutions segment are primarily marketed directly to OEMs through a technical sales organization. Within this segment, engineering capabilities, technical service, price, quality and established customer relationships are key competitive advantages.
Approximately forty percent of this segment’s revenue comes from the On-Highway product line (Power-Packer and Gits brand names), with sales to the heavy duty truck, automotive and specialty vehicle markets. Products include hydraulic cab-tilt and latching systems which are sold to global heavy duty truck OEMs such as Volvo, Scania, Paccar-DAF, FAW and CNHTC, as well as automotive electro-hydraulic convertible top latching and actuation systems. The automotive convertible top actuation systems are utilized on both retractable soft and hard top vehicles manufactured by OEMs such as Daimler, General Motors, Volkswagen and BMW. Our diesel engine air flow solutions, such as exhaust gas recirculation (“EGR”) systems and air flow actuators, are used by diesel engine and turbocharger manufacturers to reduce emissions, improve fuel efficiency and increase horsepower. Primary end markets include heavy duty truck and equipment serving customers such as Caterpillar, Cummins, Honeywell and Borg Warner.
The broad range of products, technologies and engineered solutions offered by Weasler Engineering, maximatecc and Elliott Manufacturing comprise the Agriculture, Off-Highway and Other product line within the segment. Products include severe-duty electronic instrumentation (including displays and clusters, machine controls and sensors), HMI solutions and power transmission products (highly engineered power transmission components including drive shafts, torque limiters, gearboxes, torsional dampers and flexible shafts). These products are sold to a variety of niche markets including agricultural, lawn & turf, construction, forestry, industrial, aerospace, material handling and security. Representative customers include John Deere, Caterpillar, CNH, Stihl and MTD Products.
International Business
Our products and services are generally available globally, with our principal markets outside the United States being Europe and Asia. In fiscal 2016 we derived 42% of our net sales from the United States, 36% from Europe, 13% from Asia, 6% from the Middle East, and 3% from other geographic areas. We have operations around the world and this geographic diversity allows us to draw on the skills of a global workforce, provides flexibility to our operations, allows us to drive economies of scale, provides revenue streams that may help offset economic trends that are specific to individual countries and offers us an opportunity to access new markets. In addition, we believe that our future growth depends, in part, on our ability to develop products and sales opportunities that successfully target developing countries. Although international operations are subject to certain risks, we continue to believe that a global presence is key to maintaining strong relationships with many of our global customers. Financial information related to the Company's geographic areas is included in Note 10, "Income Taxes" and Note 13, "Business Segment, Geographic and Customer Information" in the notes to the consolidated financial statements.
Product Development and Engineering
We conduct research and development activities to develop new products, enhance the functionality, effectiveness, ease of use and reliability of our existing products and expand the applications for our products. We believe that our engineering and research and development efforts have been key drivers of our success in the marketplace. Our advanced design and engineering capabilities contribute to the development of innovative and highly engineered products, maintain our technological leadership in each segment and enhance our ability to provide customers with unique and customized solutions and products. While much research and development activity involves improvements to existing products, our engineering staff engages in research for new products and product enhancements. We anticipate that we will continue to make significant expenditures for research and development as we seek to provide innovative products to maintain and improve our competitive position. Research and development costs are expensed as incurred, and were $18 million in both fiscal 2016 and 2015 and $20 million in fiscal 2014. We also incur significant costs in connection with fulfilling custom orders and developing unique solutions for unique customer needs, which are not included in these expense totals.
Through our advanced proprietary processes, with over 300 patents, we create products that satisfy specific customer needs and make tasks easier and more efficient for customers. No individual patent or trademark is believed to be of such importance that its termination would have a material adverse effect on our business.
Competition
The markets for all of our products are highly competitive. We provide a diverse and broad range of industrial products and systems to numerous global end markets, many of which are highly fragmented. Although we face larger competitors in several served markets, much of our competition is comprised of smaller companies that often lack the global footprint or financial resources to serve global customers. We compete for business principally on the basis of customer service, product quality and availability, engineering, research and development expertise, and price. In addition, we believe that our competitive cost structure, strategic global sourcing capabilities and global distribution support our competitive position.
Manufacturing and Operations
While we do have extensive manufacturing capabilities including machining, stamping, injection molding and fabrication, our manufacturing consists primarily of light assembly of components we source from a network of global
suppliers. We have implemented single piece flow methodology in most of our manufacturing plants, which reduces inventory levels, lowers “re-work” costs and shortens lead times to customers. Components are built to our highly engineered specifications by a variety of suppliers, including those in low cost countries such as China, Turkey, India and Mexico. We have built strong relationships with our key suppliers and, while we single source certain of our components, in most cases there are several qualified alternative sources.
Raw Material Costs and Inflation
We source a wide variety of materials and components from a network of global suppliers. These items are typically available from numerous suppliers. Raw materials that go into the components we source, such as steel and plastic resin, are subject to price fluctuations, which could have a negative impact on our results. We strive to offset such cost inflation with price increases to customers and by driving operational cost reductions.
No meaningful measures of inflation are available because we have significant operations in countries with diverse rates of inflation and currency rate movements. However, we believe that the overall rate of inflation in recent years has been relatively low and has not had a significant effect on our results of operations, after factoring in offsetting price increases and other manufacturing cost reductions.
Order Backlogs and Seasonality
Our Industrial and Energy segments have relatively short order-to-ship cycles, while our OEM oriented Engineered Solutions segment has a longer cycle, and therefore typically has a larger backlog. We had order backlogs of $149 million and $193 million at August 31, 2016 and 2015, respectively. Substantially all orders are expected to be filled within twelve months. While we typically enjoy a stronger second half of our fiscal year, our consolidated sales are not subject to significant seasonal fluctuations.
Sales Percentages by Fiscal Quarter
|
| | | | | | | | |
| | | 2016 | | 2015 | |
| Quarter 1 (September-November) | | 26 | % | | 26 | % | |
| Quarter 2 (December - February) | | 23 | % | | 24 | % | |
| Quarter 3 (March - May) | | 27 | % | | 26 | % | |
| Quarter 4 (June- August) | | 24 | % | | 24 | % | |
| | | 100 | % | | 100 | % | |
Employees
At August 31, 2016, we employed 5,200 individuals. Our employees are not subject to collective bargaining agreements, with the exception of 300 U.S. production employees, as well as certain international employees covered by government mandated collective labor agreements. We believe we have a good working relationship with our employees.
Environmental Matters
Our operations, like those of most industrial businesses, are subject to federal, state, local and foreign laws and regulations relating to the protection of the environment, including those regulating discharges of hazardous materials into the air and water, the storage and disposal of such materials and the clean-up of soil and groundwater contamination. We believe that we are in material compliance with applicable environmental regulations. Compliance with these laws has and will require expenditures on an ongoing basis. However, environmental expenditures over the last three years have not been material. Soil and groundwater contamination has been identified at certain facilities that we operate or formerly owned or operated. We are also a party to certain state and local environmental matters, have provided environmental indemnifications for certain divested businesses and retain responsibility for certain potential environmental liabilities. For further information, see Note 14, “Contingencies and Litigation” in the notes to consolidated financial statements.
Executive Officers of the Registrant
The names, ages and positions of all of the executive officers of the Company as of October 15, 2016 are listed below.
|
| | | | | |
Name | | Age | | Position |
Randal W. Baker | | 53 |
| | President and Chief Executive Officer |
Kenneth C. Bockhorst | | 43 |
| | Executive Vice President—Energy Segment |
Andrew G. Lampereur | | 53 |
| | Executive Vice President and Chief Financial Officer |
Roger A. Roundhouse | | 51 |
| | Executive Vice President—Engineered Solutions Segment |
Stephen J. Rennie | | 58 |
| | Executive Vice President—Industrial Segment |
Eugene E. Skogg | | 59 |
| | Executive Vice President—Global Human Resources |
Theodore C. Wozniak | | 58 |
| | Executive Vice President—Business Development |
Randal W. Baker, President, Chief Executive Officer. Mr. Baker was appointed President and Chief Executive Officer of the Company in March 2016. Prior to joining the Company, Mr. Baker held multiple roles during a six year tenure at Joy Global, including most recently as Chief Operating Officer. Prior to Joy Global, Mr. Baker was an executive with Case New Holland Inc., holding a variety of roles including President and CEO of its agricultural equipment business. Mr. Baker also held diverse leadership roles in marketing, sales, product development and engineering at Komatsu America Corporation, Ingersoll-Rand and Sandvik Corporation.
Kenneth C. Bockhorst, Executive Vice President—Energy Segment. Mr. Bockhorst joined the Company in 2011 as Global Operations Leader for our Enerpac business. He was promoted to the Business Leader of our global Hydratight business in October 2014 and was named Executive Vice President - Energy Segment in April 2016. Prior to joining the Company, Mr. Bockhorst held product management and operational leadership roles at IDEX Corporation and Eaton Corporation.
Andrew G. Lampereur, Executive Vice President and Chief Financial Officer. Mr. Lampereur joined the Company in 1993 as Corporate Controller, a position he held until 1996 when he was appointed Vice President of Finance for the Gardner Bender business (former Electrical segment). In 1998, Mr. Lampereur was appointed Vice President, General Manager for Gardner Bender. He was appointed to his present position in August 2000. Prior to joining the Company, Mr. Lampereur held a number of financial management positions at Terex Corporation. Mr. Lampereur is currently a director of Generac Holdings Inc and was a director of Robbins & Myers, Inc. from 2005 through 2013.
Roger A. Roundhouse, Executive Vice President—Engineered Solutions Segment. Mr. Roundhouse joined the Company in 2014, from General Cable, where he most recently held the position of Senior Vice President and General Manager Utility Products. Mr. Roundhouse brings extensive automotive, industrial and OEM knowledge, as well as over 20 years of experience with mergers & acquisitions and global operations.
Stephen J. Rennie, Executive Vice President - Industrial Segment. Mr. Rennie joined the Company in 2012 as the Business Leader for our Weasler Engineering business and was promoted to President of our global Enerpac business in 2014. In August 2016, he was named Executive Vice President - Industrial Segment. Prior to joining the Company, Mr. Rennie held various global leadership roles for the industrial technologies sector of Ingersoll Rand.
Eugene E. Skogg, Executive Vice President—Human Resources. Mr. Skogg joined the Company in 2015 from Terex Corporation. During his eight year tenure at Terex, Mr. Skogg held multiple human resources and leadership roles, including most recently Vice President Business Integration. Prior to joining Terex, Mr. Skogg held various human resources roles for The Stanley Works, Merck and General Electric.
Theodore C. Wozniak, Executive Vice President—Business Development. Mr. Wozniak joined the Company in 2006 in his current position. Prior to joining Actuant, Mr. Wozniak held senior investment banking positions at Wachovia Securities, most recently as Managing Director of the Industrial Growth Corporate Finance Group. Mr. Wozniak was employed by Wachovia Securities for ten years. Prior to that, Mr. Wozniak held various investment banking positions at First Chicago Capital Markets and Riggs National Corporation.
Item 1A. Risk Factors
The risks and uncertainties described below are those that we have identified as material, but are not the only risks and uncertainties facing us. If any of the events contemplated by the following risks actually occurs, then our business, financial condition, or results of operations could be materially adversely affected. Additional risks and uncertainties not currently known to us or that we currently believe are immaterial also may adversely impact our business.
Deterioration of or instability in the global economy and overall challenging end market conditions could impact our ability to grow the business and adversely impact our financial condition, results of operations and cash flows.
Our businesses and operating results have been, and will continue to be, affected by worldwide economic conditions. The level of demand for our products depends, in part, on the general economic conditions that exist in our served end markets. A substantial portion of our revenues are derived from customers in cyclical industries (vehicles, industrial, oil & gas, agriculture and mining) that typically are adversely affected by downward economic cycles. As global economic uncertainty continues, our customers may experience deterioration of their businesses, which may delay or lengthen sales cycles. In response to recent economic weakness, we have implemented various restructuring initiatives aimed at reducing our cost structure and improving operational performance. We expect to incur additional restructuring costs in future periods, including facility consolidations and workforce reductions in order to reduce costs in our business. Although we expect that the related cost savings and realization of efficiencies will offset the restructuring related costs over time, we may not achieve the desired net benefits.
Our business is dependent upon the level of activity in the energy sector, particularly the oil and gas industry. The level of activity in the energy sector is influenced by supply and demand, country-specific energy policies, regional reliance on fossil fuels and the availability, affordability and market support of alternative energy sources.
Energy markets historically have experienced significant volatility. We primarily serve these markets through our Energy and Industrial segments. Energy sector activity can fluctuate significantly in a short period of time, particularly in the United States, North Sea, the Middle East, Brazil and Australia, amongst other regions. Demand for our products and services depends on a number of factors, including the number of offshore oil & gas wells being drilled, the maintenance and condition of industry assets, the volume of exploration and production activities and the capital expenditures of asset owners and maintenance companies. The willingness of asset owners and operators to make capital expenditures to produce and explore for sources of energy will continue to be influenced by numerous factors over which we have no control, including:
| |
• | the current and anticipated future prices for energy sources, including oil and natural gas, solar, wind and nuclear; |
| |
• | level of excess production capacity; |
| |
• | cost of exploring for and producing energy sources; |
| |
• | worldwide economic activity and associated demand for energy sources; |
| |
• | availability and access to potential hydrocarbon resources; |
| |
• | national government political requirements; |
| |
• | development of alternate energy sources; and |
| |
• | environmental regulations. |
Our growth strategy includes strategic acquisitions. We may not be able to consummate future acquisitions or successfully integrate them.
A significant portion of our growth has come from strategic acquisitions of businesses. We plan to continue making acquisitions to enhance our global market position and broaden our product offerings. Our ability to successfully execute acquisitions will be impacted by a number of factors, including the availability of financing on terms acceptable to us, our ability to identify acquisition candidates that meet our valuation parameters and increased competition for acquisitions. The process of integrating acquired businesses into our existing operations may result in unforeseen operating difficulties and may require additional financial resources and attention from management that would otherwise be available for the ongoing development or expansion of our existing operations. Failure to effectively execute our acquisition strategy or successfully integrate the acquired businesses could have an adverse effect on our financial condition, results of operations, cash flows and liquidity.
We may not be able to realize the anticipated benefits from acquired companies.
We may not be able to realize the anticipated benefits from acquired companies. Achieving those benefits depends on the timely, efficient and successful execution of a number of post-acquisition events, including integrating the acquired business into the Company. Factors that could affect our ability to achieve these benefits include:
| |
• | difficulties in integrating and managing personnel, financial reporting and other systems used by the acquired businesses; |
| |
• | the failure of acquired businesses to perform in accordance with our expectations; |
| |
• | failure to achieve anticipated synergies between our business units and the business units of acquired businesses; |
| |
• | the loss of customers of acquired businesses; or |
| |
• | the loss of key managers of acquired businesses. |
If acquired businesses do not operate as we anticipate, it could materially impact our business, financial condition and results of operations. In addition, acquired businesses may operate in niche markets in which we have little or no experience. In such instances, we will be highly dependent on existing managers and employees to manage those businesses, and the loss of any key managers or employees of the acquired business could have a material adverse effect on our financial condition, results of operations, cash flows and liquidity.
The indemnification provisions of acquisition agreements by which we have acquired companies may not fully protect us and may result in unexpected liabilities.
Certain of the acquisition agreements from past acquisitions require the former owners to indemnify us against certain liabilities related to the operation of each of their companies before we acquired it. In most of these agreements, however, the liability of the former owners is limited in amount and duration and certain former owners may not be able to meet their indemnification responsibilities. These indemnification provisions may not fully protect us, and as a result we may face unexpected liabilities that adversely affect our profitability and financial position.
Our goodwill and other intangible assets represent a substantial amount of our total assets.
Our total assets reflect substantial intangible assets, primarily goodwill. At August 31, 2016, goodwill and other intangible assets totaled $759 million, or 53% of our total assets. The goodwill results from our acquisitions, representing the excess of cost over the fair value of the net tangible and other identifiable intangible assets we have acquired. We assess annually whether there has been impairment in the value of our goodwill or indefinite-lived intangible assets. If future operating performance at one or more of our reporting units were to fall below current levels, we could be required to recognize a non-cash charge to operating earnings for goodwill or other intangible asset impairment. We recognized a $187 million and $84 million non-cash impairment charge in fiscal 2016 and 2015, respectively, related to the goodwill, intangible assets and long-lived assets of several of our businesses (see Note 4, "Goodwill, Intangible Assets and Long-Lived Assets" and "Critical Accounting Policies" for further discussion on goodwill, intangible asset and long-lived asset impairments). Any future goodwill or intangible asset impairments could negatively affect our financial condition and results of operations.
Divestitures and discontinued operations could negatively impact our business, and retained liabilities from businesses that we sell could adversely affect our financial results.
As part of our portfolio management process, we review our operations for businesses which may no longer be aligned with our strategic initiatives and long-term objectives. Over the past three years we divested our former Electrical segment and several product lines. Divestitures pose risks and challenges that could negatively impact our business, including required separation or carve-out activities and costs, disputes with buyers or potential impairment charges. We may also dispose of a business at a price or on terms that are less than we had previously anticipated. After reaching an agreement with a buyer for the disposition of a business, we are also subject to satisfaction of pre-closing conditions, as well as necessary regulatory and governmental approvals on acceptable terms, which may prevent us from completing a transaction. Dispositions may also involve continued financial involvement, as we may be required to retain responsibility for, or agree to indemnify buyers against contingent liabilities related to a businesses sold, such as lawsuits, tax liabilities, lease payments, product liability claims or environmental matters. Under these types of arrangements, performance by the divested businesses or other conditions outside of our control could affect future financial results.
If we fail to develop new products or customers do not accept our new products, our business could be adversely affected.
Our ability to develop innovative new products can affect our competitive position and often requires the investment of significant resources. Difficulties or delays in research, development, production or commercialization of new products or failure to gain market acceptance of new products and technologies may reduce future sales and adversely affect our competitive position. We continue to invest in the development and marketing of new products through our G + I process. There can be no assurance that we will have sufficient resources to make such investments, that we will be able to make the technological advances necessary to maintain competitive advantages or that we can recover major research and development expenses. If we fail to make innovations, launch products with quality problems or the market does not accept our new products, then our financial condition, results of operations, cash flows and liquidity could be adversely affected. A lack of successful new product developments may also cause customers to buy from a competitor or may cause us to have to reduce prices to compete.
Our indebtedness could harm our operating flexibility and competitive position.
We have incurred, and may in the future incur, significant indebtedness in connection with acquisitions and share repurchases. We have, and will continue to have, a substantial amount of debt which requires interest and principal payments. Our level of debt and the limitations imposed on us by our debt agreements could adversely affect our operating flexibility and put us at a competitive disadvantage.
Our ability to make scheduled principal and interest payments, refinance our indebtedness and satisfy our other debt and lease obligations will depend upon our future operating performance and credit market conditions, which could be affected by factors beyond our control. In addition, there can be no assurance that future borrowings or equity financings will be available to us on favorable terms, or at all, for the payment or refinancing of our indebtedness. If we are unable to service our indebtedness, our business, financial condition and results of operations will be adversely affected.
Our failure to comply with the financial and other covenants in our debt agreements would adversely affect us.
Our senior credit agreement and our other debt agreement contain financial and other restrictive covenants. These covenants could adversely affect us by limiting our financial and operating flexibility as well as our ability to plan for and react to market conditions and to meet our capital needs. Our failure to comply with these covenants could result in events of default which, if not cured or waived, could result in us being required to repay indebtedness before its due date, and we may not have the financial resources or be able to arrange alternative financing to do so. Borrowings under our senior credit facility are secured by most domestic personal property assets and are guaranteed by most of our domestic subsidiaries and by a pledge of the stock of most of our domestic and certain foreign subsidiaries. If borrowings under our senior credit facility were declared or became due and payable immediately as the result of an event of default and we were unable to repay or refinance those borrowings, the lenders could foreclose on the pledged assets and stock. Any event that requires us to repay any of our debt before it is due could require us to borrow additional amounts at unfavorable borrowing terms, cause a significant reduction in our liquidity and impair our ability to pay amounts due on our indebtedness. Moreover, if we are required to repay any of our debt before it becomes due, we may be unable to borrow additional amounts or otherwise obtain the cash necessary to repay that debt, when due, which could seriously harm our business.
Our ability to execute our share repurchases depends, in part, on our results of operations, liquidity and changes in the trading price of our Class A common stock.
The stock markets in general have experienced substantial price and trading fluctuations, which have resulted in volatility in the market prices of securities that often are unrelated or disproportionate to changes in operating performance. These broad market fluctuations may adversely affect the trading price of our Class A common stock. Price volatility over a given period may also cause the average price at which we repurchase our own common stock to exceed the stock’s price at a given point in time. In addition, significant changes in the trading price of our Class A common stock and our ability to access capital on terms favorable to us could impact our ability to repurchase shares of our common stock. Despite significant share repurchases over the last several years, the timing and amount of future repurchases is dependent on cash flows from operations and available liquidity, the amount of capital deployed for acquisitions and the market price of our common stock.
Our businesses operate in highly competitive markets, so we may be forced to cut prices or incur additional costs.
Our businesses generally face substantial competition in each of their respective markets. We may lose market share in certain businesses or be forced to reduce prices or incur increased costs to maintain existing business. We compete on the basis of product design, quality, availability, performance, customer service and price. The entry of a large company into one of our markets, or its acquisition of an existing competitor, could adversely impact our competitiveness due to greater financial or other resources. Present or future competitors may have greater financial, technical or other resources which could put us at a competitive disadvantage.
Our international operations pose currency and other risks.
We continue to focus on penetrating global markets as part of our overall growth strategy and expect sales from and into foreign markets to continue to represent a significant portion of our revenue. Approximately 58% of our sales in fiscal 2016 were outside the United States. In addition, many of our manufacturing operations and suppliers are located outside the United States. Our international operations present special risks, primarily from currency exchange rate fluctuations, exposure to local economic and political conditions, export and import restrictions, controls on repatriation of cash and exposure to local political conditions. In particular, changes in foreign currency exchange rates will continue to add volatility as over one-half of our sales are generated outside of the United States in currencies other than the U.S. dollar. In addition, there have been several proposals to reform international taxation rules in the United States. We earn a substantial portion of our income from international operations and therefore changes to United States international tax rules may have a material adverse effect on future results of operations or liquidity. To the extent that we expand our international presence, these risks may increase.
Geopolitical unrest and terrorist activities may cause the economic conditions in the U.S. or abroad to deteriorate, which could harm our business.
Terrorist attacks against targets in the U.S. or abroad, rumors or threats of war, other geopolitical activity or trade disruptions may impact our operations or cause general economic conditions in the U.S. and abroad to deteriorate. A prolonged economic slowdown or recession in the U.S. or in other areas of the world could reduce the demand for our products and, therefore, negatively affect our future sales. Any of these events could have a significant impact on our business, financial condition or results of operations.
The assembly nature of our operations means that we purchase a significant amount of components from suppliers for the manufacture, assembly and sale of our products and our reliance on suppliers involves certain risks.
We rely on suppliers to secure component products and finished goods required for the manufacture and assembly of our products. A disruption in deliveries to or from suppliers or decreased availability of components or commodities could have an adverse effect on our ability to meet our commitments to customers or increase our operating costs. Further, poor supplier quality or an insecure supply chain could adversely affect the reliability, performance, and reputation of our products. Additionally, if demand for our products is less than we expect, we may experience excess inventories and be forced to incur additional charges and our profitability may suffer. Our business, competitive position, results of operations or financial condition could be negatively impacted if supply is insufficient for our operations, if we experience excess inventories or if we are unable to adjust our production schedules or our purchases from suppliers to reflect changes in customer demand and market fluctuations on a timely basis.
Large or rapid increases in the costs of commodities and raw materials or substantial decreases in their availability could adversely affect our operations.
The primary raw materials that are used in our products include steel, plastic resin, brass, steel wire and rubber. Most of our suppliers are not currently parties to long-term contracts with us. Consequently, we are vulnerable to fluctuations in prices of such raw materials. If market prices for certain materials such as steel or plastic resin rise, it could have a negative effect on our operating results and our ability to manufacture products on a timely basis. Factors such as supply and demand, freight costs and transportation availability, inventory levels, the level of imports and general economic conditions may affect the prices of raw materials that we need. If we experience a significant increase in raw material prices, or if we are unable to pass along increases in raw material prices to our customers, our results of operations could be adversely affected. In addition, an increasing portion of our products are sourced from low cost regions. Changes in export laws, taxes and disruptions in transportation routes could adversely impact our results of operations.
Regulatory and legal developments including changes to United States taxation rules, health care reform, conflict mineral supply chain compliance, governmental climate change initiatives and failure to comply with anti-corruption laws could negatively affect our financial performance.
Our operations and the markets we compete in are subject to numerous federal, state, local and foreign governmental laws and regulations. Existing laws and regulations may be revised or reinterpreted and new laws and regulations, including with respect to taxation, health care reform, conflict minerals compliance and governmental climate change initiatives, may be adopted or become applicable to us or customers. These regulations are complex, change frequently and have become more stringent over time. We cannot predict the form any such new laws or regulations will take or the impact any of these laws and regulations will have on our business or operations. Any significant change in any of these regulations could reduce demand for our products or increase our cost of producing these products.
Due to our global operations, we are subject to many laws governing international relations, including those that prohibit improper payments to government officials and commercial customers, and restrict where we can do business, what information or products we can supply to certain countries and what information we can provide to a non-U.S. government, including but not limited to the Foreign Corrupt Practices Act, UK Bribery Act and the U.S. Export Administration Act. Violations of these laws, which are complex, may result in criminal penalties or sanctions that could have a material adverse effect on our business, financial condition and results of operations.
Environmental laws and regulations may result in additional costs.
We are subject to federal, state, local and foreign laws and regulations governing public and worker health and safety. Any violations of these laws by us could cause us to incur unanticipated liabilities that could harm our operating results. Pursuant to such laws, governmental authorities have required us to contribute to the cost of investigating or remediating certain matters at current or previously owned and operated sites. In addition, we provided environmental indemnities in connection with the sale of certain businesses and product lines. Liability as an owner or operator, or as an arranger for the treatment or disposal of hazardous substances, can be joint and several and can be imposed without regard to fault. There is a risk that costs relating to
these matters could be greater than what we currently expect or exceed our insurance coverage, or that additional remediation and compliance obligations could arise which require us to make material expenditures. In particular, more stringent environmental laws, unanticipated remediation requirements or the discovery of previously unknown conditions could materially harm our financial condition and operating results. We are also required to comply with various environmental laws and maintain permits, some of which are subject to discretionary renewal from time to time, for many of our businesses, and our business operations could be restricted if we are unable to renew existing permits or to obtain any additional permits that we may require.
Any loss of key personnel and the inability to attract and retain qualified employees could have a material adverse impact on our operations.
We are dependent on the continued services of key executives such as our Chief Executive Officer, Chief Financial Officer, Executive Vice President - Business Development, Executive Vice President - Global Human Resources and executives in charge of our segments. We currently do not have employment agreements with most of these or other officers. The departure of key personnel without adequate replacement could severely disrupt our business operations. Additionally, we need qualified managers and skilled employees with technical and manufacturing industry experience to operate our businesses successfully. From time to time there may be shortages of skilled labor which may make it more difficult and expensive for us to attract and retain qualified employees. If we are unable to attract and retain qualified individuals or our costs to do so increase significantly, our operations would be materially adversely affected.
Our operations are highly dependent on information technology infrastructure and failures could significantly affect our business.
We depend heavily on our information technology ("IT") systems and infrastructure in order to achieve our business objectives. If we experience a significant problem that impairs this infrastructure, such as a computer virus, cyber-attack, a problem with the functioning of an important IT application or an intentional disruption of our IT systems by a third party, the resulting disruptions could impede our ability to record or process orders, manufacture and ship in a timely manner or otherwise carry on our business in the ordinary course. Our information systems could also be penetrated by outside parties intent on extracting information, corrupting information or disrupting business processes. Such unauthorized access could disrupt our business and could result in the loss of assets. Any such events could cause us to lose customers or revenue and could require us to incur significant expense to eliminate these problems and address related security concerns.
We are subject to litigation, including product liability and warranty claims that may adversely affect our financial condition and results of operations.
We are, from time to time, a party to litigation that arises in the normal course of our business operations, including product warranty and liability claims, contract disputes and environmental, asbestos, employment and other litigation matters. We face an inherent business risk of exposure to product liability and warranty claims in the event that the use of our products is alleged to have resulted in injury or other damage. While we currently maintain general liability and product liability insurance coverage in amounts that we believe are adequate, we may not be able to maintain this insurance on acceptable terms and the insurance may not provide sufficient coverage against potential liabilities that may arise. Any claims brought against us, with or without merit, may have an adverse effect on our business and results of operations as a result of potential adverse outcomes, the expenses associated with defending such claims, the diversion of our management's resources and time and the potential adverse effect to our business reputation.
If our intellectual property protection is inadequate, others may be able to use our technologies and tradenames and thereby reduce our ability to compete, which could have a material adverse effect on us, our financial condition and results of operations.
We regard much of the technology underlying our services and products and the trademarks under which we market our products as proprietary. The steps we take to protect our proprietary technology may be inadequate to prevent misappropriation of our technology, or third parties may independently develop similar technology. We rely on a combination of patent, trademark, copyright and trade secret laws, employee and third-party non-disclosure agreements and other contracts to establish and protect our technology and other intellectual property rights. These agreements may be breached or terminated, and we may not have adequate remedies for any breach, and existing trade secrets, patent and copyright law may afford us limited protection. Policing unauthorized use of our intellectual property is difficult. A third party could copy or otherwise obtain and use our products or technology without authorization. Litigation may be necessary for us to defend against claims of infringement or to protect our intellectual property rights and could result in substantial cost to us and diversion of our efforts. Further, we might not prevail in such litigation which could harm our business.
We or our products could infringe on the intellectual property of others, which may cause us to engage in costly litigation and, if we are not successful, could cause us to pay substantial damages and prohibit us from selling our products.
Third parties may assert infringement or other intellectual property claims against us based on their patents or other intellectual property claims, and we may have to pay substantial damages, possibly including treble damages, if it is ultimately determined that our products infringe. We may have to obtain a license to sell our products if it is determined that our products infringe upon another party’s intellectual property. We might be prohibited from selling our products before we obtain a license, which, if available at all, may require us to pay substantial royalties. Even if infringement claims against us are without merit, defending these types of lawsuits takes significant time, may be expensive and may divert management attention from other business concerns.
Item 1B. Unresolved Staff Comments
None.
Item 2. Properties
As of August 31, 2016, we operated the following facilities (square footage in thousands):
|
| | | | | | | | | | | | | | | | | | |
| | Number of Locations | | Square Footage |
| | | | Distribution / Sales / Admin | | | | |
| | Manufacturing | | Total | | Owned | | Leased | | Total |
Industrial | | 12 |
| | 8 |
| | 20 |
| | 199 |
| | 630 |
| | 829 |
|
Energy | | 8 |
| | 28 |
| | 36 |
| | 81 |
| | 1,038 |
| | 1,119 |
|
Engineered Solutions | | 11 |
| | 4 |
| | 15 |
| | 753 |
| | 665 |
| | 1,418 |
|
Corporate and other | | 1 |
| | 4 |
| | 5 |
| | 353 |
| | 164 |
| | 517 |
|
| | 32 |
| | 44 |
| | 76 |
| | 1,386 |
| | 2,497 |
| | 3,883 |
|
We consider our facilities suitable and adequate for the purposes for which they are used and do not anticipate difficulty in renewing existing leases as they expire or in finding alternative facilities. Our largest facilities are located in the United States, the United Kingdom, the Netherlands, Mexico, Turkey and China. We also maintain a presence in Australia, Azerbaijan, Brazil, Finland, France, Germany, Hungary, India, Indonesia, Italy, Japan, Kazakhstan, Norway, Russia, Singapore, South Africa, South Korea, Spain, Sweden and the United Arab Emirates. See Note 8, “Leases” in the notes to the consolidated financial statements for information regarding our lease commitments.
Item 3. Legal Proceedings
We are a party to various legal proceedings that have arisen in the normal course of business. These legal proceedings typically include product liability, environmental, labor, patent claims and other disputes.
We have recorded reserves for estimated losses based on the specific circumstances of each case. Such reserves are recorded when it is probable that a loss has been incurred as of the balance sheet date and the amount of the loss can be reasonably estimated. In our opinion, the resolution of these contingencies is not likely to have a material adverse effect on our financial condition, results of operations or cash flows. For further information refer to Note 14, “Contingencies and Litigation” in the notes to consolidated financial statements.
Item 4. Mine Safety Disclosures
Not applicable.
PART II
| |
Item 5. | Market for Registrant’s Common Equity, Related Shareholder Matters and Issuer Purchases of Equity Securities |
The Company’s Class A common stock is traded on the New York Stock Exchange under the symbol ATU. At September 30, 2016, there were 1,353 shareholders of record of Actuant Corporation Class A common stock. The high and low sales prices of the common stock were as follows for the previous two fiscal years:
|
| | | | | | | | | | |
Fiscal Year | | Period | | High | | Low |
2016 | | June 1, 2016 to August 31, 2016 | | $ | 27.26 |
| | $ | 21.70 |
|
| | March 1, 2016 to May 31, 2016 | | 27.29 |
| | 22.98 |
|
| | December 1, 2015 to February 29, 2016 | | 24.80 |
| | 21.12 |
|
| | September 1, 2015 to November 30, 2015 | | 25.10 |
| | 17.57 |
|
2015 | | June 1, 2015 to August 31, 2015 | | $ | 24.42 |
| | $ | 19.76 |
|
| | March 1, 2015 to May 31, 2015 | | 25.57 |
| | 23.50 |
|
| | December 1, 2014 to February 28, 2015 | | 29.26 |
| | 22.62 |
|
| | September 1, 2014 to November 30, 2014 | | 33.64 |
| | 28.54 |
|
Dividends
In fiscal 2016, the Company declared a dividend of $0.04 per common share payable on October 14, 2016 to shareholders of record on September 30, 2016. In fiscal 2015, the Company declared a dividend of $0.04 per common share payable on October 15, 2015 to shareholders of record on September 30, 2015.
Share Repurchases
The Company's Board of Directors has authorized the repurchase of shares of the Company's common stock under publicly announced share repurchase programs. Since the inception of the initial share repurchase program in fiscal 2012, the Company has repurchased 20,439,434 shares of common stock (approximately 25% of its outstanding shares) for $618 million. The following table summarizes share repurchases during the fourth quarter of fiscal 2016.
|
| | | | | | | | | | |
Period | | Shares Repurchased | | Average Price Paid per Share | | Maximum Number of Shares That May Yet Be Purchased Under the Program |
June 1 to June 30, 2016 | | 112,955 |
| | $ | 26.33 |
| | 7,560,566 |
|
July 1 to July 31, 2016 | | — |
| | — |
| | 7,560,566 |
|
August 1 to August 31, 2016 | | — |
| | — |
| | 7,560,566 |
|
| | 112,955 |
| | $ | 26.33 |
| | |
Securities Authorized for Issuance under Equity Compensation Plans
The information required by Item 201(d) of Regulation S-K is provided under Item 12, Security Ownership of Certain Beneficial Owners and Management and Related Stockholder Matters, which is incorporated herein by reference.
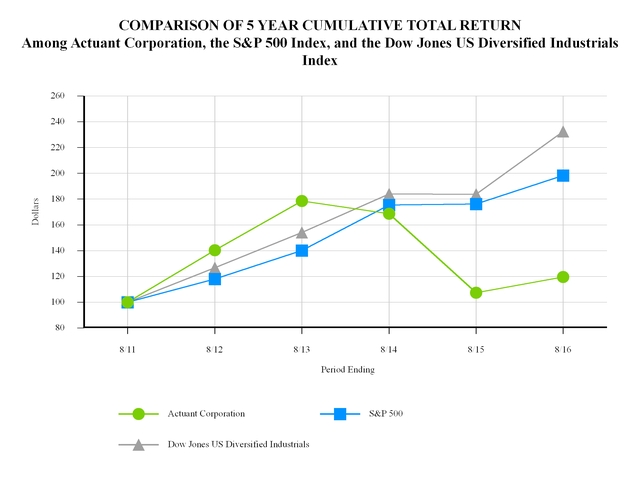
Performance Graph:
The graph below compares the cumulative 5-year total return of Actuant Corporation’s common stock with the cumulative total returns of the S&P 500 index and the Dow Jones US Diversified Industrials index. The graph tracks the performance of a $100 investment in our common stock and in each of the indexes (with the reinvestment of all dividends) from August 31, 2011 to August 31, 2016.
Copyright(c) 2013 S&P, a division of The McGraw-Hill Companies Inc. All rights reserved.
Copyright(c) 2013 Dow Jones & Co. All rights reserved.
|
| | | | | | | | | | | | | | | | | | | | | | | | |
| | 8/11 | | 8/12 | | 8/13 | | 8/14 | | 8/15 | | 8/16 |
Actuant Corporation | | $ | 100.00 |
| | $ | 140.32 |
| | $ | 178.48 |
| | $ | 168.71 |
| | $ | 107.38 |
| | $ | 119.62 |
|
S&P 500 | | 100.00 |
| | 118.00 |
| | 140.07 |
| | 175.43 |
| | 176.27 |
| | 198.40 |
|
Dow Jones US Diversified Industrials | | 100.00 |
| | 126.79 |
| | 154.07 |
| | 183.92 |
| | 183.70 |
| | 232.48 |
|
The stock price performance included in this graph is not necessarily indicative of future stock price performance.
Item 6. Selected Financial Data
The following selected historical financial data have been derived from the consolidated financial statements of the Company. The data should be read in conjunction with these financial statements and “Management’s Discussion and Analysis of Financial Condition and Results of Operations.”
|
| | | | | | | | | | | | | | | | | | | | |
| | Year Ended August 31, |
| | 2016 | | 2015 | | 2014 | | 2013 | | 2012 |
| | (in millions, except per share data) |
Statement of Earnings Data(1)(2): | | | | | | | | | | |
Net sales | | $ | 1,149 |
| | $ | 1,249 |
| | $ | 1,400 |
| | $ | 1,280 |
| | $ | 1,277 |
|
Gross profit | | 403 |
| | 462 |
| | 547 |
| | 507 |
| | 512 |
|
Selling, administrative and engineering expenses | | 274 |
| | 300 |
| | 332 |
| | 294 |
| | 285 |
|
Amortization of intangible assets | | 23 |
| | 24 |
| | 25 |
| | 23 |
| | 22 |
|
Restructuring charges | | 15 |
| | — |
| | — |
| | — |
| | — |
|
Loss (gain) on product line divestiture | | 5 |
| | — |
| | (13 | ) | | — |
| | — |
|
Impairment charges | | 187 |
| | 84 |
| | — |
| | — |
| | — |
|
Operating profit (loss) | | (100 | ) | | 54 |
| | 203 |
| | 190 |
| | 205 |
|
Earnings (loss) from continuing operations | | (105 | ) | | 20 |
| | 141 |
| | 148 |
| | 125 |
|
| | | | | | | | | | |
Diluted earnings (loss) per share from continuing operations | | $ | (1.78 | ) | | $ | 0.32 |
| | $ | 1.95 |
| | $ | 1.98 |
| | $ | 1.68 |
|
Cash dividends per share declared | | $ | 0.04 |
| | $ | 0.04 |
| | $ | 0.04 |
| | $ | 0.04 |
| | $ | 0.04 |
|
| | | | | | | | | | |
Diluted weighted average common shares | | 59,010 |
| | 62,055 |
| | 72,486 |
| | 74,580 |
| | 74,940 |
|
| | | | | | | | | | |
Balance Sheet Data (at end of period)(2): | |
|
| |
|
| |
|
| |
|
| |
|
|
Cash | | $ | 180 |
| | $ | 169 |
| | $ | 109 |
| | $ | 104 |
| | $ | 68 |
|
Assets | | 1,443 | | 1,637 | | 1,857 | | 2,119 | | 2,007 |
Debt | | 584 | | 588 | | 390 | | 515 | | 398 |
Net debt (debt less cash) | | 404 | | 419 | | 281 | | 411 | | 330 |
_______________________
| |
(1) | Results are from continuing operations and exclude the financial results of previously divested businesses reported as discontinued operations (former Electrical segment). |
| |
(2) | We have completed various acquisitions that impact the comparability of the selected financial data. The results of operations for these acquisitions are included in our financial results for all periods subsequent to their acquisition date. The following table summarizes the significant acquisitions that were completed during the last five fiscal years (amounts in millions): |
|
| | | | | | | | | | | | |
| | | | | | | | |
Acquisition | | Segment | | Date Completed | | Sales (a) | | Purchase Price |
Pipeline and Process Services (b) | | Energy | | March 2016 | | $ | 32 |
| | $ | 66 |
|
Larzep, S.A. | | Industrial | | February 2016 | | 8 |
| | 16 |
|
Hayes Industries, Ltd. | | Industrial | | May 2014 | | 25 |
| | 31 |
|
Viking SeaTech | | Energy | | August 2013 | | 90 |
| | 235 |
|
CrossControl AB | | Engineered Solutions | | July 2012 | | 40 |
| | 41 |
|
Turotest Medidores Ltda | | Engineered Solutions | | March 2012 | | 13 |
| | 8 |
|
Jeyco Pty Ltd | | Energy | | February 2012 | | 20 |
| | 21 |
|
_______________________
(a)Represents approximate annual sales at the time of the acquisition.
(b)Acquired the Middle East, Caspian and North Africa operations of Four Quest Energy Inc.
Item 7. Management’s Discussion and Analysis of Financial Condition and Results of Operations
Background
As discussed in Item 1, “Business,” we are a global diversified company that manufactures a broad range of industrial products and systems and are organized into three reportable segments, Industrial, Energy and Engineered Solutions. The Industrial segment is primarily engaged in the design, manufacture and distribution of branded hydraulic and mechanical tools to the maintenance, industrial, infrastructure and production automation markets. The Energy segment provides joint integrity products and services, customized offshore vessel mooring solutions, as well as rope and cable solutions to the global oil & gas, power generation and energy markets. The Engineered Solutions segment provides highly engineered position and motion control systems to OEMs in various on and off-highway vehicle markets, as well as a variety of other products to the industrial and agriculture markets.
Business Update
Sales in most of our end markets are expected to remain sluggish during fiscal 2017 given the challenging and inconsistent demand we have experienced in industrial, mining, infrastructure, oil & gas, commercial and off-highway vehicles and agriculture markets. Tepid global industrial demand, reduced capital spending in oil & gas markets (exploration, drilling and commissioning activities) and inventory destocking by OEMs in vehicle and agriculture markets are expected to be headwinds in fiscal 2017. As a result, we expect fiscal 2017 core sales (sales growth excluding the impact of acquisitions, divestitures and changes in foreign currency exchange rates) to decline 2-6%, compared to a 6% decline in fiscal 2016.
Despite these unfavorable market conditions, our Industrial segment is focused on accelerating global sales growth through geographic expansion (especially Asia Pacific), new product introductions and regional growth via second tier brands. We expect the Industrial segment year-over-year core sales trend to improve in the second half of fiscal 2017 due to easier comparables and traction on new sales initiatives. After outperforming the general energy markets in fiscal 2016, our Energy segment is expected to deliver double digit core sales declines in fiscal 2017, the result of tough comparables, including a large subsea connector order and elevated manpower services (Middle East refinery maintenance) in the first half of fiscal 2016. The Energy segment remains focused on the integration of the recent Pipeline and Process Services acquisition, redirecting sales, marketing and engineering resources to non-oil & gas vertical markets and providing new and existing customers with critical products, services and solutions in a dynamic energy environment. End user demand in our Engineered Solutions segment appears to have stabilized, but we are expecting first half fiscal 2017 headwinds due to inventory destocking by OEM's and dealers, before reaching equilibrium in the second half of the fiscal year. Overall for the Engineered Solutions segment, we are expecting flat core sales growth in fiscal 2017 as weakness in agriculture markets, coupled with high inventory levels in agriculture and other off-highway markets are expected to be partially offset by single digit sales growth in heavy duty truck demand. The Engineered Solutions segment is focused on execution of restructuring projects and lean manufacturing initiatives while improving sales (expansion of served markets and additional content with existing OEMs).
As a result of these and other factors, we are continuing cost reduction programs across all three segments to reduce the impact of lower customer demand on our profitability. During fiscal 2016, we incurred $15 million of restructuring costs and anticipate restructuring actions (facility consolidation, headcount reductions and operational improvements) to continue at a similar level throughout fiscal 2017. Despite these challenging end market conditions, we continue to generate substantial cash flow from operating activities, including $118 million in fiscal 2016. Our priorities during fiscal 2017 include focused efforts to drive additional sales growth, investments in growth initiatives including strategic acquisitions, execution of restructuring actions and cash flow generation.
Historical Financial Data (in millions)
|
| | | | | | | | | | | | | | | | | | | | | |
| | Year Ended August 31, |
| | 2016 | | 2015 | | 2014 |
Statements of Earnings Data: | | | | | | | | | | | | |
Net sales | | $ | 1,149 |
| | 100 | % | | $ | 1,249 |
| | 100 | % | | $ | 1,400 |
| | 100 | % |
Cost of products sold | | 746 |
| | 65 | % | | 787 |
| | 63 | % | | 853 |
| | 61 | % |
Gross profit | | 403 |
| | 35 | % | | 462 |
| | 37 | % | | 547 |
| | 39 | % |
Selling, administrative and engineering expenses | | 274 |
| | 24 | % | | 300 |
| | 24 | % | | 332 |
| | 24 | % |
Restructuring charges | | 15 |
| | 1 | % | | — |
| | 0 | % | | — |
| | 0 | % |
Loss (gain) on product line divestiture | | 5 |
| | 0 | % | | — |
| | 0 | % | | (13 | ) | | (1 | )% |
Amortization of intangible assets | | 23 |
| | 2 | % | | 24 |
| | 2 | % | | 25 |
| | 2 | % |
Impairment charges | | 187 |
| | 16 | % | | 84 |
| | 7 | % | | — |
| | 0 | % |
Operating profit (loss) | | (100 | ) | | (9 | )% | | 54 |
| | 4 | % | | 203 |
| | 15 | % |
Financing costs, net | | 29 |
| | 3 | % | | 28 |
| | 2 | % | | 25 |
| | 2 | % |
Other expense, net | | 1 |
| | 0 | % | | — |
| | 0 | % | | 4 |
| | 0 | % |
Earnings (loss) from continuing operations before income tax expense | | (130 | ) | | (11 | )% | | 26 |
| | 2 | % | | 174 |
| | 12 | % |
Income tax (benefit) expense | | (25 | ) | | (2 | )% | | 6 |
| | 0 | % | | 33 |
| | 2 | % |
Earnings (loss) from continuing operations | | (105 | ) | | (9 | )% | | 20 |
| | 2 | % | | 141 |
| | 10 | % |
Earnings from discontinued operations, net of income taxes | | — |
| | 0 | % | | — |
| | 0 | % | | 22 |
| | 2 | % |
Net earnings (loss) | | $ | (105 | ) | | (9 | )% | | $ | 20 |
| | 2 | % | | $ | 163 |
| | 12 | % |
| | | | | | | | | | | | |
Other Financial Data: | | | | | | | | | | | | |
Depreciation | | $ | 25 |
| | | | $ | 29 |
| | | | $ | 35 |
| | |
Capital expenditures | | 20 |
| | | | 23 |
| | | | 42 |
| | |
Fiscal 2016 compared to Fiscal 2015
Consolidated sales in fiscal 2016 were $1.15 billion, 8% lower than the prior year sales of $1.25 billion. Core sales were down 6%, as a result of challenging end market conditions. Changes in foreign currency exchange rates also unfavorably impacted sales comparisons by $45 million, while fiscal 2016 acquisitions added $19 million of sales. In addition to the impact of changes in foreign currency exchange rates, acquisitions and economic conditions, the comparability of results between periods is impacted by sales levels, product mix and the timing and amount of restructuring costs and related benefits. Lower production levels and absorption of manufacturing costs, as well as unfavorable sales mix and restructuring charges (as we adjust our cost structure by consolidating facilities and reducing headcount) resulted in reduced operating profit margins in fiscal 2016. Additionally, fiscal 2016 and 2015 results both include impairment charges related to the write-down of acquired goodwill, intangible assets and long-lived assets, which reduced operating profit margins.
Fiscal 2015 compared to Fiscal 2014
Consolidated sales in fiscal 2015 were $1.25 billion, 11% lower than fiscal 2014 sales of $1.40 billion. The significant strengthening of the U.S. dollar against most currencies had a $91 million unfavorable impact to our sale comparison, as well as an approximate $0.15 earnings per share reduction. Most of our businesses faced cyclical headwinds and unfavorable market conditions, which resulted in a consolidated 5% core sales decline in fiscal 2015. Fiscal 2015 financial results also included an $84 million non-cash impairment charge related to our Energy businesses, a reduced tax expense (the result of lower pre-tax book earnings and several tax minimization projects and benefits from the favorable resolution of income tax audits) since fiscal 2015 has a higher ETR when compared to fiscal 2014.
Segment Results
Industrial Segment
The Industrial segment is primarily engaged in the design, manufacture and distribution of branded hydraulic and mechanical tools that are used in maintenance and other applications in a variety of industrial, energy, infrastructure and
production automation markets. The following table sets forth comparative results of operations for the Industrial segment (in millions):
|
| | | | | | | | | | | | |
| | Year Ended August 31, |
| | 2016 | | 2015 | | 2014 |
Net Sales | | $ | 360 |
| | $ | 402 |
| | $ | 414 |
|
Operating Profit | | 80 |
| | 106 |
| | 120 |
|
Operating Profit % | | 22.2 | % | | 26.3 | % | | 29.1 | % |
Fiscal 2016 compared to Fiscal 2015
Fiscal 2016 Industrial segment net sales decreased by $42 million (11%) from fiscal 2015 to $360 million. Excluding $4 million of additional sales from the recent Larzep acquisition and an $8 million unfavorable impact of changes in foreign currency exchange rates, fiscal 2016 core sales declined 10% on a year-over-year basis. Sales declined due to reduced global industrial activity (especially in energy related markets), challenging end market conditions and cautious spending patterns by customers for heavy lifting and large infrastructure projects. Operating profit margins were 22.2% in fiscal 2016 compared to 26.3% in fiscal 2015. Lower production levels (absorption of fixed costs), unfavorable sales mix (which reduced margins by 125 basis points), as well as $3 million of restructuring charges resulted in lower operating profit margins in fiscal 2016.
Fiscal 2015 compared to Fiscal 2014
Fiscal 2015 Industrial segment net sales declined by $12 million (3%) to $402 million from $414 million in fiscal 2014. Excluding $29 million of sales from the Hayes acquisition and a $21 million unfavorable foreign currency exchange impact, fiscal 2015 core sales declined 3%. This reduction reflected reduced general industrial activity, unfavorable market conditions in several served markets (including oil & gas and mining), as well as distributor inventory destocking. Operating profit margin was 26.3% in fiscal 2015 compared to 29.1% in the prior year. Unfavorable acquisition mix, due to a full year of sales from the Hayes acquisition in fiscal 2014 (which generates lower profit margins than the segment in aggregate) and reduced leverage on fixed manufacturing and selling, administrative and engineering expenses equally contributed to the 280 basis point reduction in operating profit margins.
Energy Segment
The Energy segment provides joint integrity products and services, customized offshore vessel mooring, as well as rope and cable solutions to the global energy market. The following table sets forth comparative operating results for the Energy segment (in millions):
|
| | | | | | | | | | | | |
| | Year Ended August 31, |
| | 2016 | | 2015 | | 2014 |
Net Sales | | $ | 393 |
| | $ | 412 |
| | $ | 462 |
|
Operating Profit (Loss) | | (108 | ) | | (41 | ) | | 56 |
|
Operating Profit (Loss) % | | (27.4 | )% | | (10.0 | )% | | 12.2 | % |
Fiscal 2016 compared to Fiscal 2015
Fiscal 2016 Energy segment net sales decreased by $19 million from fiscal 2015 to $393 million, a 2% core sales decline (excluding $15 million of sales from the recent Pipeline and Process Services acquisition and the $25 million unfavorable impact of changes in foreign currency exchange rates). Core sales from our Energy Maintenance & Integrity product line (Hydratight) increased $30 million (12%) in fiscal 2016, the result of strong global demand for technical manpower services on maintenance projects and a large subsea connector order. However, core sales in the Other Energy Solutions product line, consisting of rope and cable solutions and off-shore marine mooring declined $39 million (26%) in fiscal 2016 due to reduced industry capital spending, lower oil & gas prices and increased price pressure. Energy segment operating losses are the result of impairment charges of $141 million and $84 million in fiscal 2016 and 2015, respectively. Excluding the impairment charges, Energy segment operating profit margin was 8.4% and 10.4% for fiscal 2016 and 2015, respectively. Unfavorable sales mix, which reduced margins by 375 basis points due to sharply higher service revenue and reduced mooring rental activity as well as $6 million of restructuring charges in fiscal 2016 were partially offset by restructuring savings.
Fiscal 2015 compared to Fiscal 2014
Fiscal 2015 Energy segment net sales declined $50 million from fiscal 2014 ($36 million of which was attributable to changes in foreign currency exchange rates) to $412 million. Energy segment core sales declined $14 million, or 3% in fiscal
2015. Revenue from our Energy Maintenance and Integrity product line declined $2 million, or 1% in fiscal 2015, primarily the result of customers deferring maintenance activities during the back half of the fiscal year. Sales in the Other Energy Solutions product line, consisting of umbilical & rope solutions and offshore mooring, declined $12 million (7%) due to reduced exploration, drilling and commissioning activities (in response to sharp declines in oil & gas prices). The operating loss in fiscal 2015 was driven by an $84 million impairment charge related to the write-down of goodwill and intangible assets. Excluding this item, fiscal 2015 operating profit and margins were $43 million and 10.4%, respectively. Fiscal 2015 operating profit margin, excluding the impairment charge, declined modestly from the prior year as downsizing costs and lower rental fleet and service technician utilization in 2015 were partially offset by reduced acquisition retention agreement expense at Viking, as well as favorable sales mix.
Engineered Solutions Segment
The Engineered Solutions segment provides highly engineered position and motion control systems to original equipment manufacturers in various on and off-highway vehicle markets, as well as, a variety of other products to the industrial and agricultural markets. The following table sets forth comparative results of operations for the Engineered Solutions segment (in millions):
|
| | | | | | | | | | | | |
| | Year Ended August 31, |
| | 2016 | | 2015 | | 2014 |
Net Sales | | $ | 397 |
| | $ | 435 |
| | $ | 524 |
|
Operating Profit (Loss) | | (43 | ) | | 20 |
| | 55 |
|
Operating Profit (Loss) % | | (10.8 | )% | | 4.6 | % | | 10.6 | % |
Fiscal 2016 compared to Fiscal 2015
Fiscal 2016 Engineered Solutions net sales decreased $38 million (9%) to $397 million versus the prior year. Excluding the $12 million unfavorable impact of foreign currency rate changes and sales from the Sanlo product line that we divested on August 25, 2016, core sales declined 6% in fiscal 2016 due to lower sales to OEMs that were reducing excess inventory levels, coupled with unfavorable market conditions in off-highway vehicles and agriculture markets. The operating loss in fiscal 2016 resulted from a $46 million impairment charge related to our maximatecc business and a $5 million loss on the Sanlo divestiture. Operating profit margins were also adversely impacted by unfavorable product mix and reduced absorption on lower production volumes and inventory reduction efforts. In addition, restructuring costs to consolidate facilities and reduce headcount totaled $5 million in fiscal 2016, and further reduced operating profit.
Fiscal 2015 compared to Fiscal 2014
Net sales in the Engineered Solutions segment decreased $89 million (17%) from fiscal 2014 to $435 million in fiscal 2015. Excluding the $35 million impact of unfavorable foreign currency rate changes and the $22 million of fiscal 2014 revenues from the divested RV product line, core sales declined 7% in fiscal 2015 due to reduced demand in auto and off-highway equipment markets. Operating profit declined in fiscal 2015 due to the inclusion of a $13 million RV divestiture gain in fiscal 2014, unfavorable product mix, restructuring costs, material cost inflation at international locations resulting from the stronger U.S. dollar and reduced absorption on lower production volumes.
Corporate
Since corporate expenses are considered to be for general corporate purposes, we do not allocate these expenses to our segments. Corporate expenses were relatively unchanged at $29 million, $31 million and $29 million in fiscal 2016, 2015 and 2014, respectively.
Financing Costs, Net
Net financing costs were $29 million in fiscal 2016, $28 million in fiscal 2015 and $25 million in fiscal 2014, with the increase since fiscal 2014 attributable to higher net debt balances.
Income Tax Expense
Our income tax expense is impacted by a number of factors, including the amount of taxable earnings derived in foreign jurisdictions with tax rates that are lower than the U.S. federal statutory rate, state tax rates in the jurisdictions where we do business, tax minimization planning and our ability to utilize various tax credits and loss carryforwards to reduce income tax expense. Income tax expense also includes the impact of provision to tax return adjustments, changes in valuation allowances
and reserve requirements for unrecognized tax benefits. Pre-tax earnings (loss), income tax expense (benefit) and effective income tax rate from continuing operations for the past three years were as follows:
|
| | | | | | | | | |
| | Year Ended August 31, |
| | 2016 | | 2015 | | 2014 |
Earnings (loss) from continuing operations before income taxes | | (130,344 | ) | | 25,391 |
| | 174,026 |
|
Income tax expense (benefit) | | (25,170 | ) | | 5,519 |
| | 32,573 |
|
Effective income tax rate | | 19.3 | % | | 21.7 | % | | 18.7 | % |
The comparability of pre-tax earnings (loss), income tax expense (benefit) and the related effective income tax rates are impacted by impairment charges. Fiscal 2016 results include a $187 million ($169 million after tax) impairment charge, while fiscal 2015 included an $84 million ($83 million after tax) impairment charge. Excluding the impairment charge, the fiscal 2016 effective tax rate was (13.7)%, which was lower than the prior year due to a favorable mix of taxable earnings, the benefits of tax planning initiatives and discrete tax adjustments.
Both the current and prior year income tax provisions included a materially similar income tax benefits from global tax planning initiatives (current year tax planning related to the deductibility of foreign currency losses for tax purposes); however, in the current year those initiatives as a percentage had an increased impact on the effective tax rate due to lower pre-tax book earnings in fiscal 2016 (excluding the impairment charge). In addition, the tax provision for fiscal 2016 included a $7 million income tax benefit on the Sanlo divestiture and 53% of earnings from foreign jurisdictions (with tax rates lower than the U.S. federal income tax rate) compared to 68% in fiscal 2015.
Income tax expense in fiscal 2015 included a net $10 million reduction in reserves for unrecognized tax benefits and a greater proportion of earnings from lower taxed foreign jurisdictions (compared to fiscal 2014), which were partially offset by a $2 million increase in valuation allowances. Fiscal 2014 income tax expense included a net $11 million income tax benefit from a change in income tax accounting method and a reduction in the reserve for unrecognized tax benefits (as a result of the lapsing of non-U.S. income tax statutes of limitation) which were somewhat offset by $11 million of incremental income taxes on the RV product line divestiture.
Discontinued Operations
We divested our former Electrical segment in December 2013. The former Electrical segment was primarily involved in the design, manufacture and distribution of a broad range of electrical products to the retail DIY, wholesale, OEM, solar, utility, marine and other hard environment markets. The final divestiture resulted in a pre-tax gain on disposal of $34 million (see Note 3, "Discontinued Operations and Divestitures" in the notes to the consolidated financial statements for further discussion). The results of operations for the former Electrical segment have been reported in discontinued operations for all periods.
Liquidity and Capital Resources
At August 31, 2016, cash and cash equivalents is comprised of $172 million of cash held by foreign subsidiaries and $8 million held domestically. We periodically utilize income tax safe harbor provisions to make temporary short-term intercompany advances from our foreign subsidiaries to our U.S. parent. Temporary intercompany advances, which are utilized to reduce outstanding debt balances, were $54 million and $160 million at August 31, 2016 and 2015, respectively. The following table summarizes the cash flow attributable to operating, investing and financing activities (in millions):
|
| | | | | | | | | | | | |
| | Year Ended August 31, |
| | 2016 | | 2015 | | 2014 |
Net cash provided by operating activities | | $ | 118 |
| | $ | 131 |
| | $ | 126 |
|
Net cash (used in) provided by investing activities | | (83 | ) | | (21 | ) | | 262 |
|
Net cash used in financing activities | | (18 | ) | | (15 | ) | | (382 | ) |
Effect of exchange rate changes on cash | | (5 | ) | | (35 | ) | | (1 | ) |
Net increase in cash and cash equivalents | | $ | 11 |
| | $ | 60 |
| | $ | 5 |
|
Cash flow from operations were $118 million in fiscal 2016, a $13 million reduction from the prior year due to lower cash earnings, somewhat offset by improved working capital management, reduced cash tax payments and lower annual incentive compensation payments. These cash flows from operations, $7 million of proceeds from the sale leaseback of several facilities and existing cash balances were utilized to repurchase 712,955 shares of common stock ($17 million) and fund $82 million of acquisitions and $20 million of capital expenditures.
Cash flow from operating activities in fiscal 2015 was $131 million, while cash used in investing activities for net capital expenditures was $21 million. Operating cash flows and borrowings under the Senior Credit Facility funded the $212 million repurchase of approximately 8 million shares of the Company's common stock. The translational impact of the significant strengthening of the U.S. dollar in fiscal 2015 reduced our cash balances by $35 million.
Cash flow from operating activities in fiscal 2014 were $126 million. Investing activities during fiscal 2014 included $42 million of net capital expenditures, $41 million of proceeds from the sale leaseback of Viking rental assets and the receipt of $290 million in proceeds from the divestitures of the former Electrical Segment and RV product line. Existing cash, operating and investing cash flows funded the $31 million Hayes acquisition and $284 million of stock buybacks, as well as the repayment of $125 million of revolver borrowings.
Primary Working Capital Management
We use primary working capital as a percentage of sales as a key metric for working capital efficiency. We define this metric as the sum of net accounts receivable and net inventory less accounts payable, divided by the past three month's sales annualized. The following table shows the components of the primary working capital (amounts in millions):
|
| | | | | | | | | | | | | | |
| | August 31, 2016 | | August 31, 2015 |
| | $ | | PWC % | | $ | | PWC % |
Accounts receivable, net | | $ | 187 |
| | 17 | % | | $ | 193 |
| | 16 | % |
Inventory, net | | 131 |
| | 12 | % | | 143 |
| | 12 | % |
Accounts payable | | (115 | ) | | (10 | )% | | (118 | ) | | (10 | )% |
Net primary working capital | | $ | 203 |
| | 18 | % | | $ | 218 |
| | 18 | % |
Excluding the $2 million reduction in primary working capital due to changes in foreign currency exchange rates and the $11 million increase due to acquisition/divestiture activity, primary working capital decreased $24 million in the year, reflecting lower inventory levels and a reduction in accounts receivable, primarily as a result of lower sales levels.
Liquidity
Our Senior Credit Facility matures on May 8, 2020, and includes a $600 million revolving credit facility, a $300 million term loan and a $450 million expansion option. Quarterly principal payments of $4 million on the term loan commenced on June 30, 2016, and increase to $8 million per quarter beginning on June 30, 2017, with the remaining principal due at maturity. At August 31, 2016, we had $180 million of cash and cash equivalents. Unused revolver capacity was $592 million at August 31, 2016, of which $180 million was available for borrowing. We believe that the revolver, combined with our existing cash on hand and anticipated operating cash flows will be adequate to meet operating, debt service, stock buyback, acquisition and capital expenditure funding requirements for the foreseeable future.
Seasonality and Working Capital
Although there are modest seasonal factors within certain of our businesses, on a consolidated basis, we do not experience material changes in seasonal working capital or capital resource requirements. We meet working capital and capital expenditure requirements through a combination of operating cash flow and revolver availability under our Senior Credit Facility.
Our receivables are derived from a diverse customer base spread across a number of industries, with our largest single customer generating approximately 3% of fiscal 2016 net sales.
Capital Expenditures
The majority of our manufacturing activities consist of assembly operations. We believe that our capital expenditure requirements are not as extensive as other industrial companies given the nature of our operations. Capital expenditures were $20 million, $23 million and $42 million in fiscal 2016, 2015 and 2014, respectively. Capital expenditures in fiscal 2014 were higher than historical levels due to the purchase of mooring assets in the Energy segment required to support large project
growth in the Asia Pacific region. Capital expenditures for fiscal 2017 are expected to be $20 - $25 million, but could vary from that depending on business performance, growth opportunities and the amount of assets we lease instead of purchase.
Commitments and Contingencies
Given our desire to allocate cash flow and revolver availability to fund growth initiatives, we typically lease most of our operating equipment and facilities. We lease certain facilities, computers, equipment and vehicles under various operating lease agreements, generally over periods ranging from one to twenty years. Under most arrangements, we pay the property taxes, insurance, maintenance and expenses related to the leased property. Many of the leases include provisions that enable us to renew the lease based upon fair value rental rates on the date of expiration of the initial lease.
We are contingently liable for certain lease payments under leases of businesses that we previously divested or spun-off. Some of these businesses were subsequently sold to third parties. If any of these businesses do not fulfill their future lease payment obligations under the leases, we could be liable for such leases. The present value of future minimum lease payments for these leases was $16 million at August 31, 2016 (including $12 million related to the former Electrical segment). As of August 31, 2016, future minimum lease payments on previously divested or spun-off businesses were as follows: $3 million in fiscal 2017; $3 million in fiscal 2018; $2 million in each fiscal 2019, 2020, and 2021 and $4 million in aggregate thereafter.
We had outstanding letters of credit totaling $18 million at both August 31, 2016 and 2015, the majority of which relate to commercial contracts and self-insured workers compensation programs.
Contractual Obligations
The timing of payments due under our contractual commitments is as follows (in millions):
|
| | | | | | | | | | | | | | | | | | | | | | | | | | | | |
| | Payments Due |
| | 2017 | | 2018 | | 2019 | | 2020 | | 2021 | | Thereafter | | Total |
Debt (short- and long-term) | | $ | 19 |
| | $ | 30 |
| | $ | 30 |
| | $ | 217 |
| | $ | — |
| | $ | 288 |
| | $ | 584 |
|
Interest on long-term debt | | 23 |
| | 23 |
| | 22 |
| | 21 |
| | 16 |
| | 13 |
| | 118 |
|
Operating leases | | 33 |
| | 27 |
| | 24 |
| | 20 |
| | 14 |
| | 45 |
| | 163 |
|
Deferred acquisition purchase price | | 1 |
| | 2 |
| | — |
| | — |
| | — |
| | — |
| | 3 |
|
| | $ | 76 |
| | $ | 82 |
| | $ | 76 |
| | $ | 258 |
| | $ | 30 |
| | $ | 346 |
| | $ | 850 |
|
Interest on long-term debt assumes the current interest rate environment and revolver borrowings consistent with August 31, 2016 debt levels.
Our contractual obligations generally relate to amounts due under contracts with third party service providers. These contracts are primarily for real estate leases, information technology services and telecommunications services. Only those obligations that are not cancelable are included in the table.
We routinely issue purchase orders to numerous vendors for inventory and other supplies. These purchase orders are
generally cancelable with reasonable notice to the vendor, and are therefore excluded from this table.
We have long-term obligations related to our deferred compensation, pension and postretirement plans that are excluded from this table, summarized in Note 9, “Employee Benefit Plans” in the notes to consolidated financial statements.
Our liability for unrecognized tax benefits was $29 million at August 31, 2016, but is not included in the table of contractual obligations because the timing of the potential settlements of these uncertain tax positions cannot be reasonably estimated.
Critical Accounting Policies
We prepare our consolidated financial statements in conformity with U.S. generally accepted accounting principles (“GAAP”). This requires management to make estimates and assumptions that affect reported amounts and related disclosures. Actual results could differ from those estimates. The following policies are considered by management to be the most critical in understanding the judgments that are involved in the preparation of our consolidated financial statements and the uncertainties that could impact our results of operations, financial position and cash flows.
Revenue recognition: We recognize revenue when persuasive evidence of an arrangement exists, delivery has occurred, the sales price is fixed or determinable and collectability of the sales price is reasonably assured. For product sales, delivery does not occur until the passage of title and risk of loss have transferred to the customer (generally when products are shipped). Revenue from service and rental contracts are recognized when the services are provided or ratably over the contract term. We record allowances for discounts, product returns and customer incentives at the time of sale as a reduction of revenue as such
allowances can be reliably estimated based on historical experience and known trends. We also offer warranty on our products and accrue for warranty claims at the time of sale based upon the length of the warranty period, historical warranty cost trends and any other related information.
Inventories: Inventories are stated at the lower of cost or market. Inventory cost is determined using the last-in, first-out (“LIFO”) method for a portion of U.S. owned inventory (approximately 21% and 22% of total inventories at both August 31, 2016 and 2015, respectively). The first-in, first-out or average cost method is used for all other inventories. If the LIFO method were not used, the inventory balance would be higher than the amount in the consolidated balance sheet by $4 million at August 31, 2016 and $6 million at August 31, 2015. We perform an analysis of the historical sales usage of the individual inventory items on hand and a reserve is recorded to adjust inventory cost to market value. The inventory valuation assumptions used are based on historical experience. We believe that such estimates are made based on consistent and appropriate methods; however, actual results may differ from these estimates under different assumptions or conditions.
Goodwill and Long-Lived Assets:
Goodwill Impairment Review, Estimates and Sensitivity: The purchase price allocation for acquired businesses typically results in recording goodwill and other intangible assets, which are a significant portion of our total assets. On an annual basis, or more frequently if triggering events occur, we compare the estimated fair value of our reporting units to the carrying value to determine if a potential goodwill impairment exists. If the fair value of a reporting unit is less than its carrying value an impairment loss is recorded for the difference between the implied fair value and the carrying value of the reporting unit's goodwill. The estimated fair value represents the amount we believe a reporting unit could be bought or sold for in a current transaction between willing parties on an arms-length basis.
In estimating the fair value, we generally use a discounted cash flow model, which is dependent on a number of assumptions including estimated future revenues and expenses, weighted average cost of capital, capital expenditures and other variables. The expected future revenue growth rates and operating profit margins are determined after taking into consideration our historical revenue growth rates and earnings levels, our assessment of future market potential and our expectations of future business performance. Under the discounted cash flow approach, the fair value is calculated as the sum of the projected discounted cash flows over a discrete seven year period plus an estimated terminal value. In certain circumstances we also review a market approach in which a trading multiple is applied to a forecasted EBITDA (earnings before interest, income taxes, depreciation and amortization) of the reporting unit to arrive at the estimated fair value.
Fiscal 2015 Impairment Charge: The dramatic decline in oil prices, reduced capital spending by asset owners and suspended drilling and exploration activities caused us to review the recoverability of goodwill, intangible assets and fixed assets of our Energy segment businesses during the second quarter of fiscal 2015. Similar to other energy industry suppliers, we revised our financial projections to reflect market conditions, including lower sales and profit levels. The uncertainty and volatility in the global oil & gas markets resulted in a second quarter fiscal 2015 goodwill impairment charge of $40 million in our Cortland reporting unit and $38 million in our Viking reporting unit.
Fiscal 2016 Interim Impairment Charge: During the second quarter of fiscal 2016, we determined that there were interim “triggering events” that required a review of the recoverability of the goodwill and long-lived assets of three reporting units (Cortland, Viking and maximatecc).
Cortland and Viking Reporting Units: Continued unfavorable market conditions, including continued cuts in oil & gas capital spending, reduced exploration, drilling and commissioning activities and excess capacity for mooring rental assets, resulted in a 33% core sales decline in the second quarter of fiscal 2016 at Viking and Cortland, which comprise our Other Energy Services product line. As a result of lower projected sales and profits, we recognized a goodwill impairment charge of $74 million.
Maximatecc Reporting Unit: The maximatecc reporting unit, including the legacy North American business and acquisitions of CrossControl (Europe) and Turotest (South America), manufactures severe-duty electronic instrumentation including displays and clusters, machine controls and sensors. These products are primarily marketed to industrial vehicle original equipment manufacturers (“OEMs”) and system suppliers in a number of industries, including industrial, material hauling, construction, agriculture, forestry, mining, utility, cargo, marine and rail. Weakness in off-highway vehicle and agricultural markets, coupled with challenging overall industrial fundamentals, recent reductions in OEM customer build rates and production schedules (in order to reduce inventory levels) and delays in the start of production by certain European OEMs for new or updated design models resulted in reduced sales and profitability of the maximatecc business. As a result of lower projected sales and profits, we recognized a $46 million impairment charge related to the goodwill of the maximatecc business.
Fiscal 2016 Year-End Impairment Test: Our fourth quarter fiscal 2016 impairment review resulted in one reporting unit (Cortland) having an estimated fair value that exceeded the carrying value (expressed as a percentage of the carrying value) by less than 30%. While we believe that the Cortland business will generate positive cash flow and earnings in the long-term, the financial projections utilized in the impairment review considered both historical results and current challenging conditions in the global oil & gas markets. Estimated future cash flows from the business assume low single digit sales growth in fiscal 2017 (after a greater than 10% sales decline in fiscal 2016) and slightly improved profitability, the result of previously completed restructuring actions and favorable sales mix. The future financial results of this reporting unit are dependent on the realization of savings from restructuring actions and material cost reductions, the timing and level of recovery in the global oil & gas markets and our ability to retain and win new business in other end markets. The assumptions that have the most significant impact on determination of the fair value of the Cortland reporting unit are the discount rate (10.5% at August 31, 2016) and sales growth rate, including 3.0% in the terminal year. A 100 basis point increase in the discount rate results in a reduction to the estimated fair value of the reporting unit by 13%, while a reduction in the terminal year sales growth rate assumption by 100 basis points would decrease the estimated fair value by 9%. The carrying value of the Cortland reporting unit was $91 million (including $36 million in goodwill) at August 31, 2016.
Indefinite-lived intangibles (tradenames): Indefinite lived intangible assets are also subject to annual impairment testing. On an annual basis or more frequently if a triggering event occurs, the fair value of indefinite lived assets, based on a relief of royalty valuation approach, are evaluated to determine if an impairment charge is required. We recognized interim impairment charges to write-down the value of tradenames by $17 million and $6 million in fiscal 2016 and 2015, respectively, as the result of reduced sales projections and royalty rates, which reflected current and future profitability estimates. Our fourth quarter fiscal 2016 impairment review resulted in one indefinite lived intangible asset for which the estimated fair value exceeded the carrying value of $17 million by 21%. A reduction in sales or operating profits, relative to our projections, could result in a future non-cash impairment charge related to this tradename.
Long-lived assets (fixed assets and amortizable intangible assets): We also review long-lived assets for impairment when events or changes in business circumstances indicate that the carrying amount of the assets may not be fully recoverable. If such indicators are present, we prepare an undiscounted operating cash flow analyses to determine if an impairment exists. If an impairment is determined to exist, any related impairment loss is calculated based on fair value. In the second quarter of fiscal 2016, the undiscounted operating cash flows of our Viking business did not exceed the carrying value and therefore a $52 million long-lived asset impairment was recognized, including $28 million of amortizable intangible assets and $24 million of fixed assets (primarily mooring rental assets).
A considerable amount of management judgment and assumptions are required in performing the impairment tests, principally in determining the fair value of each reporting unit and the indefinite lived intangible assets. While we believe our judgments and assumptions are reasonable, different assumptions could change the estimated fair values and, therefore, future additional impairment charges could be required. Weakening industry or economic trends, disruptions to our business, loss of significant customers, inability to effectively integrate acquired businesses, unexpected significant changes or planned changes in the use of the assets or in entity structure and divestitures may adversely impact the assumptions used in the valuations and ultimately result in future impairment charges.
Business Combinations and Purchase Accounting: We account for business combinations using the acquisition method of accounting, and accordingly, the assets and liabilities of the acquired business are recorded at their respective fair values. The excess of the purchase price over the estimated fair value is recorded as goodwill. Assigning fair market values to the assets acquired and liabilities assumed at the date of an acquisition requires knowledge of current market values, and the values of assets in use, and often requires the application of judgment regarding estimates and assumptions. While the ultimate responsibility resides with management, for certain acquisitions we retain the services of certified valuation specialists to assist with assigning estimated values to certain acquired assets and assumed liabilities, including intangible assets and tangible long-lived assets. Acquired intangible assets, excluding goodwill, are valued using a discounted cash flow methodology based on future cash flows specific to the type of intangible asset purchased. This methodology incorporates various estimates and assumptions, the most significant being projected revenue growth rates, profit margins and forecasted cash flows based on the discount rate and terminal growth rate.
Employee Benefit Plans: We provide a variety of benefits to employees and former employees, including in some cases, pensions and postretirement health care. Plan assets and obligations are recorded based on an August 31 measurement date utilizing various actuarial assumptions such as discount rates, assumed rates of return on plan assets and health care cost trend rates. We determine the discount rate assumptions by referencing high-quality, long-term bond rates that are matched to the duration of our benefit obligations, with appropriate consideration of local market factors, participant demographics and benefit payment forecasts. At August 31, 2016 and 2015, the discount rate on domestic benefit plans was 3.45% and 4.45%, respectively. In estimating the expected return on plan assets, we consider historical returns, forward-looking considerations, inflation assumptions and the asset allocation strategy in investing such assets. Domestic benefit plan assets consist primarily of
participating units in mutual funds, index funds and bond funds. The expected return on domestic benefit plan assets was 7.15% and 7.40% at August 31, 2016 and 2015, respectively. A 25 basis point change in the assumptions for the discount rate or expected return on plan assets would not materially change fiscal 2017 domestic benefit plan expense.
We review actuarial assumptions on an annual basis and make modifications based on current rates and trends when appropriate. As required by U.S. GAAP, the effects of any modifications are recorded currently or amortized over future periods. Based on information provided by independent actuaries and other relevant sources, we believe that the assumptions used are reasonable; however, changes in these assumptions could impact our financial position, results of operations or cash flows. See Note 9, “Employee Benefit Plans” in the notes to the consolidated financial statements for further discussion.
Income Taxes: Judgment is required to determine the annual effective income tax rate, deferred tax assets and liabilities, reserves for unrecognized tax benefits and any valuation allowances recorded against net deferred tax assets. Our effective income tax rate is based on annual income, statutory tax rates, tax planning opportunities available in the various jurisdictions in which we operate and other adjustments. Our annual effective income tax rate includes the impact of discrete income tax matters including adjustments to reserves for uncertain tax positions and the benefits of various income tax planning activities. Tax regulations require items to be included in our tax returns at different times than the items are reflected in our financial statements. As a result, the effective income tax rate in our financial statements differs from that reported in our tax returns. Some of these differences are permanent, such as expenses that are not deductible on our tax return, while others are temporary differences, such as amortization and depreciation expense.
Temporary differences create deferred tax assets and liabilities, which are measured using enacted tax rates expected to apply to taxable income in the years in which those temporary differences are expected to be recovered or settled. We establish valuation allowances for our deferred tax assets when the amount of expected future taxable income is not large enough to utilize the entire deduction or credit. Relevant factors in determining the realizability of deferred tax assets include future taxable income, the expected timing of the reversal of temporary differences, tax planning strategies and the expiration dates of the various tax attributes.
Use of Estimates: We record reserves, asset write-downs or allowances for customer rebates, returns and discounts, doubtful accounts, inventory, incurred but not reported medical claims, environmental matters, warranty claims, workers compensation claims, product and non-product litigation, acquisition earn out obligations and incentive compensation. These reserves require the use of estimates and judgment. We base our estimates on historical experience and on various other assumptions that are believed to be reasonable under the circumstances. We believe that such estimates are made on a consistent basis and with appropriate assumptions and methods. However, actual results may differ from these estimates.
Item 7A. Quantitative and Qualitative Disclosures About Market Risk
We are exposed to market risk from changes in foreign currency exchange rates and interest rates and, to a lesser extent, commodities. To reduce such risks, we selectively use financial instruments and other proactive management techniques. All hedging transactions are authorized and executed pursuant to clearly defined policies and procedures, which strictly prohibit the use of financial instruments for trading or speculative purposes. A discussion of our accounting policies for derivative financial instruments is included within Note 7, “Derivatives” in the notes to the consolidated financial statements.
Foreign Currency Risk—We maintain operations in the U.S. and various foreign countries. Our non-U.S. operations, the largest of which are located in Australia, the Netherlands, the United Kingdom, Mexico, United Arab Emirates and China, have foreign currency risk relating to receipts from customers, payments to suppliers and intercompany transactions denominated in foreign currencies. Under certain conditions, we enter into hedging transactions, primarily forward foreign currency swaps, that enable us to mitigate the potential adverse impact of foreign currency exchange rate risk (see Note 7, “Derivatives” in the notes to the consolidated financial statements for further information). We do not engage in trading or other speculative activities with these transactions, as established policies require that these hedging transactions relate to specific currency exposures.
The strengthening of the U.S. dollar can have an unfavorable impact on our results of operations and financial position as foreign denominated operating results are translated into U.S. dollars. To illustrate the potential impact of changes in foreign currency exchange rates on the translation of our results of operations, annual sales and operating profit were remeasured assuming a ten percent reduction in foreign exchange rates compared with the U.S. dollar. Under this assumption, annual sales and operating profit would have been $58 million and $6 million lower, respectively, for the twelve months ended August 31, 2016. This sensitivity analysis assumes that each exchange rate would change in the same direction relative to the U.S. dollar and excludes the potential effects that changes in foreign currency exchange rates may have on actual sales or price levels. Similarly, a ten percent decline in foreign currency exchange rates relative to the U.S. dollar on our August 31, 2016 financial position would result in a $62 million reduction to equity (accumulated other comprehensive loss), as a result of non U.S. dollar denominated assets and liabilities being translated into U.S. dollars, our reporting currency.
Interest Rate Risk—We manage interest expense using a mixture of fixed-rate and variable-rate debt. A change in interest rates impacts the fair value of our 5.625% Senior Notes, but not our earnings or cash flow because the interest rate on such debt
is fixed. Our variable-rate debt obligations consist primarily of revolver and term loan borrowings under our Senior Credit Facility. A ten percent increase in the average cost of our variable rate debt would have resulted in an approximate $1 million increase in financing costs for the year ended August 31, 2016.
Commodity Risk—We source a wide variety of materials and components from a network of global suppliers. While such materials are typically available from numerous suppliers, commodity raw materials, such as steel and plastic resin are subject to price fluctuations, which could have a negative impact on our results. We strive to pass along such commodity price increases to customers to avoid profit margin erosion.
Item 8. Financial Statements and Supplementary Data
|
| |
| Page |
INDEX TO CONSOLIDATED FINANCIAL STATEMENTS | |
| |
| |
| |
| |
| |
| |
| |
| |
| |
| |
| |
| |
| |
| |
| |
INDEX TO FINANCIAL STATEMENT SCHEDULE | |
| |
| |
All other schedules are omitted because they are not applicable, not required or because the required information is included in the consolidated financial statements or notes thereto.
Report of Independent Registered Public Accounting Firm
To the Board of Directors and Shareholders of Actuant Corporation:
In our opinion, the consolidated financial statements listed in the accompanying index present fairly, in all material respects, the financial position of Actuant Corporation and its subsidiaries at August 31, 2016 and August 31, 2015, and the results of their operations and their cash flows for each of the three years in the period ended August 31, 2016 in conformity with accounting principles generally accepted in the United States of America. In addition, in our opinion, the financial statement schedule listed in the accompanying index presents fairly, in all material respects, the information set forth therein when read in conjunction with the related consolidated financial statements. Also in our opinion, the Company maintained, in all material respects, effective internal control over financial reporting as of August 31, 2016, based on criteria established in Internal Control - Integrated Framework (2013) issued by the Committee of Sponsoring Organizations of the Treadway Commission (COSO). The Company's management is responsible for these financial statements and financial statement schedule, for maintaining effective internal control over financial reporting and for its assessment of the effectiveness of internal control over financial reporting, included in Management's Report on Internal Control over Financial Reporting. Our responsibility is to express opinions on these financial statements, on the financial statement schedule, and on the Company's internal control over financial reporting based on our integrated audits. We conducted our audits in accordance with the standards of the Public Company Accounting Oversight Board (United States). Those standards require that we plan and perform the audits to obtain reasonable assurance about whether the financial statements are free of material misstatement and whether effective internal control over financial reporting was maintained in all material respects. Our audits of the financial statements included examining, on a test basis, evidence supporting the amounts and disclosures in the financial statements, assessing the accounting principles used and significant estimates made by management, and evaluating the overall financial statement presentation. Our audit of internal control over financial reporting included obtaining an understanding of internal control over financial reporting, assessing the risk that a material weakness exists, and testing and evaluating the design and operating effectiveness of internal control based on the assessed risk. Our audits also included performing such other procedures as we considered necessary in the circumstances. We believe that our audits provide a reasonable basis for our opinions.
As discussed in Note 1 to the accompanying consolidated financial statements, the Company changed the manner in which it classifies deferred taxes in 2016.
A company’s internal control over financial reporting is a process designed to provide reasonable assurance regarding the reliability of financial reporting and the preparation of financial statements for external purposes in accordance with generally accepted accounting principles. A company’s internal control over financial reporting includes those policies and procedures that (i) pertain to the maintenance of records that, in reasonable detail, accurately and fairly reflect the transactions and dispositions of the assets of the company; (ii) provide reasonable assurance that transactions are recorded as necessary to permit preparation of financial statements in accordance with generally accepted accounting principles, and that receipts and expenditures of the company are being made only in accordance with authorizations of management and directors of the company; and (iii) provide reasonable assurance regarding prevention or timely detection of unauthorized acquisition, use, or disposition of the company’s assets that could have a material effect on the financial statements.
Because of its inherent limitations, internal control over financial reporting may not prevent or detect misstatements. Also, projections of any evaluation of effectiveness to future periods are subject to the risk that controls may become inadequate because of changes in conditions, or that the degree of compliance with the policies or procedures may deteriorate.
As described in “Management’s Report on Internal Control Over Financial Reporting,” management has excluded Larzep and Pipeline and Process Services (collectively “the Acquired Businesses”) from its assessment of internal control over financial reporting as of August 31, 2016 because the businesses were acquired by the Company in a purchase business combination during fiscal 2016. We have also excluded the Acquired Businesses from our audit of internal control over financial reporting. The Acquired Businesses are wholly-owned subsidiaries of the Company whose total assets and revenues represent approximately 7% and less than 2% respectively, of the related consolidated financial statement amounts as of and for the year ended August 31, 2016.
/s/ PricewaterhouseCoopers LLP
Milwaukee, Wisconsin
October 26, 2016
ACTUANT CORPORATION
CONSOLIDATED STATEMENTS OF OPERATIONS
(in thousands, except per share amounts)
|
| | | | | | | | | | | | |
| | Year Ended August 31, |
| | 2016 |
| 2015 |
| 2014 |
Net sales | | $ | 1,149,410 |
| | $ | 1,249,254 |
| | $ | 1,399,862 |
|
Cost of products sold | | 746,013 |
| | 787,413 |
| | 852,990 |
|
Gross profit | | 403,397 |
| | 461,841 |
| | 546,872 |
|
Selling, administrative and engineering expenses | | 274,497 |
| | 299,601 |
| | 332,093 |
|
Amortization of intangible assets | | 22,943 |
| | 24,333 |
| | 25,166 |
|
(Gain) loss on product line divestitures | | 5,092 |
| | — |
| | (13,495 | ) |
Restructuring charges | | 14,571 |
| | — |
| | — |
|
Impairment charges | | 186,511 |
| | 84,353 |
| | — |
|
Operating profit (loss) | | (100,217 | ) | | 53,554 |
| | 203,108 |
|
Financing costs, net | | 28,768 |
| | 28,057 |
| | 25,045 |
|
Other expense, net | | 1,359 |
| | 106 |
| | 4,037 |
|
Earnings (loss) from continuing operations before income taxes | | (130,344 | ) | | 25,391 |
| | 174,026 |
|
Income tax (benefit) expense | | (25,170 | ) | | 5,519 |
| | 32,573 |
|
Earnings (loss) from continuing operations | | (105,174 | ) | | 19,872 |
| | 141,453 |
|
Earnings from discontinued operations, net of income taxes | | — |
| | — |
| | 22,120 |
|
Net earnings (loss) | | $ | (105,174 | ) | | $ | 19,872 |
| | $ | 163,573 |
|
| | | | | | |
Earnings (loss) from continuing operations per share: | | | | | | |
Basic | | $ | (1.78 | ) | | $ | 0.32 |
| | $ | 1.99 |
|
Diluted | | $ | (1.78 | ) | | $ | 0.32 |
| | $ | 1.95 |
|
| | | | | | |
Earnings (loss) per share: | | | | | | |
Basic | | $ | (1.78 | ) | | $ | 0.32 |
| | $ | 2.31 |
|
Diluted | | $ | (1.78 | ) | | $ | 0.32 |
| | $ | 2.26 |
|
| | | | | | |
Weighted average common shares outstanding: | | | | | | |
Basic | | 59,010 |
| | 61,262 |
| | 70,942 |
|
Diluted | | 59,010 |
| | 62,055 |
| | 72,486 |
|
The accompanying notes are an integral part of these consolidated financial statements.
ACTUANT CORPORATION
CONSOLIDATED STATEMENTS OF COMPREHENSIVE INCOME (LOSS)
(in thousands)
|
| | | | | | | | | | | | |
| | Year Ended August 31, |
| | 2016 | | 2015 | | 2014 |
Net earnings (loss) | | $ | (105,174 | ) | | $ | 19,872 |
| | $ | 163,573 |
|
Other comprehensive income (loss), net of tax | | | | | | |
Foreign currency translation adjustments | | (32,203 | ) | | (143,703 | ) | | 3,344 |
|
Pension and other postretirement benefit plans | | (6,003 | ) | | (1,506 | ) | | (3,159 | ) |
Cash flow hedges | | 23 |
| | (23 | ) | | 67 |
|
Total other comprehensive income (loss), net of tax | | (38,183 | ) | | (145,232 | ) | | 252 |
|
Comprehensive income (loss) | | $ | (143,357 | ) | | $ | (125,360 | ) | | $ | 163,825 |
|
The accompanying notes are an integral part of these consolidated financial statements.
ACTUANT CORPORATION
CONSOLIDATED BALANCE SHEETS
(in thousands, except share and per share amounts)
|
| | | | | | | | |
| | August 31, |
| | 2016 | | 2015 |
A S S E T S | | | | |
Current assets | | | | |
Cash and cash equivalents | | $ | 179,604 |
| | $ | 168,846 |
|
Accounts receivable, net | | 186,829 |
| | 193,081 |
|
Inventories, net | | 130,756 |
| | 142,752 |
|
Deferred income taxes | | — |
| | 12,922 |
|
Other current assets | | 45,463 |
| | 42,788 |
|
Total current assets | | 542,652 |
| | 560,389 |
|
Property, plant and equipment | | | | |
Land, buildings, and improvements | | 41,504 |
| | 48,515 |
|
Machinery and equipment | | 268,362 |
| | 269,983 |
|
Gross property, plant and equipment | | 309,866 |
| | 318,498 |
|
Less: Accumulated depreciation | | (195,851 | ) | | (176,040 | ) |
Property, plant and equipment, net | | 114,015 |
| | 142,458 |
|
Goodwill | | 519,276 |
| | 608,256 |
|
Other intangibles, net | | 239,475 |
| | 308,762 |
|
Other long-term assets | | 27,120 |
| | 17,052 |
|
Total assets | | $ | 1,442,538 |
| | $ | 1,636,917 |
|
| | | | |
| | | | |
L I A B I L I T I E S A N D S H A R E H O L D E R S’ E Q U I T Y | | | | |
Current liabilities | | | | |
Trade accounts payable | | $ | 115,051 |
| | $ | 118,115 |
|
Accrued compensation and benefits | | 46,901 |
| | 43,707 |
|
Current maturities of debt and short-term borrowings | | 18,750 |
| | 3,969 |
|
Income taxes payable | | 9,254 |
| | 14,805 |
|
Other current liabilities | | 51,956 |
| | 54,460 |
|
Total current liabilities | | 241,912 |
| | 235,056 |
|
Long-term debt | | 565,559 |
| | 584,309 |
|
Deferred income taxes | | 31,356 |
| | 72,941 |
|
Pension and postretirement benefit liabilities | | 25,667 |
| | 17,828 |
|
Other long-term liabilities | | 57,094 |
| | 53,782 |
|
Total liabilities | | 921,588 |
| | 963,916 |
|
Shareholders’ equity | | | | |
Class A common stock, $0.20 par value per share, authorized 168,000,000 shares, issued 79,393,393 and 78,932,533 shares, respectively | | 15,879 |
| | 15,787 |
|
Additional paid-in capital | | 114,980 |
| | 104,308 |
|
Treasury stock, at cost, 20,439,434 shares and 19,726,479 shares, respectively | | (617,731 | ) | | (600,630 | ) |
Retained earnings | | 1,259,645 |
| | 1,367,176 |
|
Accumulated other comprehensive loss | | (251,823 | ) | | (213,640 | ) |
Stock held in trust | | (2,646 | ) | | (4,292 | ) |
Deferred compensation liability | | 2,646 |
| | 4,292 |
|
Total shareholders’ equity | | 520,950 |
| | 673,001 |
|
Total liabilities and shareholders’ equity | | $ | 1,442,538 |
| | $ | 1,636,917 |
|
ACTUANT CORPORATION
CONSOLIDATED STATEMENTS OF CASH FLOWS
(in thousands) |
| | | | | | | | | | | | |
| | Year Ended August 31, |
| | 2016 | | 2015 | | 2014 |
Operating Activities | | | | | | |
Net earnings (loss) | | $ | (105,174 | ) | | $ | 19,872 |
| | $ | 163,573 |
|
Adjustments to reconcile net earnings (loss) to net cash provided by operating activities: | | | | | | |
Non-cash items: | | | | | | |
Impairment charges, net of tax benefits | | 169,056 |
| | 82,635 |
| | — |
|
Depreciation and amortization | | 47,777 |
| | 53,239 |
| | 60,635 |
|
Stock-based compensation expense | | 10,442 |
| | 12,046 |
| | 17,115 |
|
Gain on disposal of businesses, net of tax benefits | | (1,557 | ) | | — |
| | (29,152 | ) |
Provision (benefit) for deferred income taxes | | (17,403 | ) | | (12,221 | ) | | 40 |
|
Amortization of debt issuance costs | | 1,652 |
| | 1,897 |
| | 1,829 |
|
Other non-cash adjustments | | (517 | ) | | 805 |
| | (168 | ) |
Changes in components of working capital and other: | |
|
| |
|
| |
|
|
Accounts receivable | | 20,261 |
| | 12,827 |
| | 1,336 |
|
Inventories | | 10,202 |
| | 6,608 |
| | (21,915 | ) |
Trade accounts payable | | (7,727 | ) | | (19,801 | ) | | (19,832 | ) |
Prepaid expenses and other assets | | (3,291 | ) | | (8,761 | ) | | 4,276 |
|
Income taxes payable/receivable | | (7,916 | ) | | (11,629 | ) | | (46,133 | ) |
Accrued compensation and benefits | | 3,912 |
| | (6,478 | ) | | 12,725 |
|
Other accrued liabilities | | (2,020 | ) | | 395 |
| | (18,149 | ) |
Cash provided by operating activities | | 117,697 |
| | 131,434 |
| | 126,180 |
|
| | | | | | |
Investing Activities | | | | | | |
Capital expenditures | | (20,209 | ) | | (22,516 | ) | | (41,857 | ) |
Proceeds from sale of property, plant and equipment | | 9,296 |
| | 1,244 |
| | 44,274 |
|
Business acquisitions, net of cash acquired | | (81,916 | ) | | — |
| | (30,500 | ) |
Proceeds from sale of businesses, net of transaction costs | | 9,695 |
| | — |
| | 289,590 |
|
Cash provided by (used in) investing activities | | (83,134 | ) | | (21,272 | ) | | 261,507 |
|
| | | | | | |
Financing Activities | | | | | | |
Net borrowings (repayments) on revolving credit facility | | (210 | ) | | 220 |
| | (125,000 | ) |
Principal repayments on term loan | | (3,750 | ) | | (3,375 | ) | | — |
|
Proceeds from term loan | | — |
| | 213,375 |
| | — |
|
Redemption of 5.625% Senior Notes | | — |
| | (11,941 | ) | | — |
|
Purchase of treasury shares | | (17,101 | ) | | (212,003 | ) | | (283,712 | ) |
Payment of contingent acquisition consideration | | — |
| | — |
| | (1,585 | ) |
Debt issuance costs | | — |
| | (2,025 | ) | | — |
|
Taxes paid related to the net share settlement of equity awards | | (1,409 | ) | | (2,466 | ) | | (946 | ) |
Stock option exercises, related tax benefits and other | | 6,416 |
| | 5,396 |
| | 32,224 |
|
Cash dividend | | (2,376 | ) | | (2,598 | ) | | (2,919 | ) |
Cash used in financing activities | | (18,430 | ) | | (15,417 | ) | | (381,938 | ) |
Effect of exchange rate changes on cash | | (5,375 | ) | | (34,911 | ) | | (723 | ) |
Net increase in cash and cash equivalents | | 10,758 |
| | 59,834 |
| | 5,026 |
|
Cash and cash equivalents - beginning of period | | 168,846 |
| | 109,012 |
| | 103,986 |
|
Cash and cash equivalents - end of period | | $ | 179,604 |
| | $ | 168,846 |
| | $ | 109,012 |
|
The accompanying notes are an integral part of these consolidated financial statements.
ACTUANT CORPORATION
CONSOLIDATED STATEMENTS OF SHAREHOLDERS’ EQUITY
(in thousands)
|
| | | | | | | | | | | | | | | | | | | | | | | | | | | | | | | | | | | |
| | Common Stock | | Additional Paid-in Capital | | Treasury Stock | | Retained Earnings | | Accumulated Other Comprehensive Loss | | Stock Held in Trust | | Deferred Compensation Liability | | Total Shareholders’ Equity |
| | Issued Shares | | Amount | |
Balance at August 31, 2013 | | 77,001 |
| | $ | 15,399 |
| | $ | 49,758 |
| | $ | (104,915 | ) | | $ | 1,188,685 |
| | $ | (68,660 | ) | | $ | (3,124 | ) | | $ | 3,124 |
| | $ | 1,080,267 |
|
Net earnings | | — |
| | — |
| | — |
| | — |
| | 163,573 |
| | — |
| | — |
| | — |
| | 163,573 |
|
Other comprehensive income, net of tax | | — |
| | — |
| | — |
| | — |
| | — |
| | 252 |
| | — |
| | — |
| | 252 |
|
Stock contribution to employee benefit plans and other | | 16 |
| | 3 |
| | 550 |
| | — |
| | — |
| | — |
| | — |
| | — |
| | 553 |
|
Restricted stock awards | | 389 |
| | 78 |
| | (78 | ) | | — |
| | — |
| | — |
| | — |
| | — |
| | — |
|
Cash dividend ($0.04 per share) | | — |
| | — |
| | — |
| | — |
| | (2,656 | ) | | — |
| | — |
| | — |
| | (2,656 | ) |
Treasury stock repurchases | | — |
| | — |
| | — |
| | (283,712 | ) | | — |
| | — |
| | — |
| | — |
| | (283,712 | ) |
Stock based compensation expense | | — |
| | — |
| | 17,115 |
| | — |
| | — |
| | — |
| | — |
| | — |
| | 17,115 |
|
Stock option exercises | | 1,065 |
| | 213 |
| | 22,210 |
| | — |
| | — |
| | — |
| | — |
| | — |
| | 22,423 |
|
Tax effect of stock option exercises and restricted stock vesting | | — |
| | — |
| | 3,509 |
| | — |
| | — |
| | — |
| | — |
| | — |
| | 3,509 |
|
Stock issued to, acquired for and distributed from rabbi trust | | 10 |
| | 2 |
| | 385 |
| | — |
| | — |
| | — |
| | (959 | ) | | 959 |
| | 387 |
|
Balance at August 31, 2014 | | 78,481 |
| | 15,695 |
| | 93,449 |
| | (388,627 | ) | | 1,349,602 |
| | (68,408 | ) | | (4,083 | ) | | 4,083 |
| | 1,001,711 |
|
Net earnings | | — |
| | — |
| | — |
| | — |
| | 19,872 |
| | — |
| | — |
| | — |
| | 19,872 |
|
Other comprehensive loss, net of tax | | — |
| | — |
| | — |
| | — |
| | — |
| | (145,232 | ) | | — |
| | — |
| | (145,232 | ) |
Stock contribution to employee benefit plans and other | | 12 |
| | 4 |
| | 459 |
| | — |
| | — |
| | — |
| | — |
| | — |
| | 463 |
|
Restricted stock awards | | 365 |
| | 73 |
| | (73 | ) | | — |
| | — |
| | — |
| | — |
| | — |
| | — |
|
Cash dividend ($0.04 per share) | | — |
| | — |
| | — |
| | — |
| | (2,298 | ) | | — |
| | — |
| | — |
| | (2,298 | ) |
Treasury stock repurchases | | — |
| | — |
| | — |
| | (212,003 | ) | | — |
| | — |
| | — |
| | — |
| | (212,003 | ) |
Stock based compensation expense | | — |
| | — |
| | 12,046 |
| | — |
| | — |
| | — |
| | — |
| | — |
| | 12,046 |
|
Stock option exercises | | 65 |
| | 13 |
| | 1,134 |
| | — |
| | — |
| | — |
| | — |
| | — |
| | 1,147 |
|
Tax effect of stock option exercises and restricted stock vesting | | — |
| | — |
| | (2,955 | ) | | — |
| | — |
| | — |
| | — |
| | — |
| | (2,955 | ) |
Stock issued to, acquired for and distributed from rabbi trust | | 10 |
| | 2 |
| | 248 |
| | — |
| | — |
| | — |
| | (209 | ) | | 209 |
| | 250 |
|
Balance at August 31, 2015 | | 78,933 |
| | 15,787 |
| | 104,308 |
| | (600,630 | ) | | 1,367,176 |
| | (213,640 | ) | | (4,292 | ) | | 4,292 |
| | 673,001 |
|
Net loss | | — |
| | — |
| | — |
| | — |
| | (105,174 | ) | | — |
| | — |
| | — |
| | (105,174 | ) |
Other comprehensive loss, net of tax | | — |
| | — |
| | — |
| | — |
| | — |
| | (38,183 | ) | | — |
| | — |
| | (38,183 | ) |
Stock contribution to employee benefit plans and other | | 20 |
| | 4 |
| | 449 |
| | — |
| | — |
| | — |
| | — |
| | — |
| | 453 |
|
Restricted stock awards | | 235 |
| | 47 |
| | (47 | ) | | — |
| | — |
| | — |
| | — |
| | — |
| | — |
|
Cash dividend ($0.04 per share) | | — |
| | — |
| | — |
| | — |
| | (2,357 | ) | | — |
| | — |
| | — |
| | (2,357 | ) |
Treasury stock repurchases | | — |
| | — |
| | — |
| | (17,101 | ) | | — |
| | — |
| | — |
| | — |
| | (17,101 | ) |
Stock based compensation expense | | — |
| | — |
| | 10,442 |
| | — |
| | — |
| | — |
| | — |
| | — |
| | 10,442 |
|
Stock option exercises | | 175 |
| | 35 |
| | 3,529 |
| | — |
| | — |
| | — |
| | — |
| | — |
| | 3,564 |
|
Tax effect of stock option exercises and restricted stock vesting | | — |
| | — |
| | (3,943 | ) | | — |
| | — |
| | — |
| | — |
| | — |
| | (3,943 | ) |
Stock issued to, acquired for and distributed from rabbi trust | | 30 |
| | 6 |
| | 242 |
| | — |
| | — |
| | — |
| | 1,646 |
| | (1,646 | ) | | 248 |
|
Balance at August 31, 2016 | | 79,393 |
| | $ | 15,879 |
| | $ | 114,980 |
| | $ | (617,731 | ) | | $ | 1,259,645 |
| | $ | (251,823 | ) | | $ | (2,646 | ) | | $ | 2,646 |
| | $ | 520,950 |
|
The accompanying notes are an integral part of these consolidated financial statements.
NOTES TO CONSOLIDATED FINANCIAL STATEMENTS
Note 1. Summary of Significant Accounting Policies
Nature of Operations: Actuant Corporation (“Actuant” or the “Company”) is a global manufacturer of a broad range of industrial products and systems, organized into three reportable segments. The Industrial segment is primarily engaged in the design, manufacture and distribution of branded hydraulic and mechanical tools to the maintenance, industrial, infrastructure and production automation markets. The Energy segment provides joint integrity products and services, customized offshore mooring solutions, as well as rope and cable solutions to the global oil & gas, energy and other markets. The Engineered Solutions segment provides highly engineered position and motion control systems to OEMs in various vehicle markets, as well as a variety of other products to the industrial and agriculture markets.
Consolidation and Presentation: The consolidated financial statements include the accounts of the Company and its subsidiaries, all of which are wholly-owned. The results of companies acquired or disposed of during the year are included in the consolidated financial statements from the effective date of acquisition or until the date of divestiture. All intercompany balances, transactions and profits have been eliminated in consolidation. Certain prior year amounts have been reclassified to conform to current year presentation.
Cash Equivalents: The Company considers all highly liquid investments with original maturities of 90 days or less to be cash equivalents.
Inventories: Inventories are comprised of material, direct labor and manufacturing overhead, and are stated at the lower of cost or market. Inventory cost is determined using the last-in, first-out (“LIFO”) method for a portion of the U.S. owned inventory (21.0% and 22.1% of total inventories in both 2016 and 2015, respectively). The first-in, first-out or average cost methods are used for all other inventories. If the LIFO method were not used, inventory balances would be higher than the amounts in the consolidated balance sheets by $3.7 million and $5.6 million at August 31, 2016 and 2015, respectively.
The nature of the Company’s products is such that they generally have a very short production cycle. Consequently, the amount of work-in-process at any point in time is minimal. In addition, many parts or components are ultimately either sold individually or assembled with other parts making a distinction between raw materials and finished goods impractical to determine. Other locations maintain and manage their inventories using a job cost system where the distinction of categories of inventory by state of completion is also not available. As a result of these factors, it is neither practical nor cost effective to segregate the amounts of raw materials, work-in-process or finished goods inventories at the respective balance sheet dates, as segregation would only be possible as the result of physical inventories which are taken at dates different from the balance sheet dates.
Property, Plant and Equipment: Property, plant and equipment are stated at cost. Plant and equipment are depreciated on a straight-line basis over the estimated useful lives of the assets, ranging from ten to forty years for buildings and improvements and two to fifteen years for machinery and equipment. Equipment includes assets (marine mooring equipment and joint integrity tools) which are rented to customers of our Energy segment businesses. Leasehold improvements are amortized over the life of the related asset or the term of the lease, whichever is shorter.
Goodwill and Other Intangible Assets: Other intangible assets with definite lives, consisting primarily of purchased customer relationships, patents, trademarks and non-compete agreements, are amortized over periods from one to twenty-five years. Goodwill and other intangible assets with indefinite lives are not subject to amortization, but are subject to annual impairment testing.
The Company’s goodwill is tested for impairment annually, during the fourth quarter, or more frequently if events or changes in circumstances indicate that goodwill might be impaired. The Company performs impairment reviews for its reporting units using a fair value method based on management’s judgments and assumptions. In estimating the fair value, the Company utilizes a discounted cash flow model, which is dependent on a number of assumptions including estimated future revenues and expenses, weighted average cost of capital, capital expenditures and other variables. The estimated fair value of the reporting unit is compared to the carrying amount of the reporting unit, including goodwill. If the carrying value of the reporting unit exceeds its fair value, the goodwill is potentially impaired and the Company then determines the implied fair value of goodwill, which is compared to the carrying value to determine if impairment exists. Indefinite lived intangible assets are also subject to an annual impairment test. On an annual basis, or more frequently if events or changes in circumstances indicate that the asset might be impaired, the fair value of the indefinite lived intangible assets are evaluated by the Company to determine if an impairment charge is required. A considerable amount of management judgment is required in performing the impairment tests, principally in determining the fair value of each reporting unit and the indefinite lived intangible assets.
ACTUANT CORPORATION
NOTES TO CONSOLIDATED FINANCIAL STATEMENTS—(Continued)
Product Warranty Costs: The Company generally offers its customers a warranty on products sold, although warranty periods may vary by product type and application. The reserve for future warranty claims is based on historical claim rates and current warranty cost experience. The following is a rollforward of the changes in product warranty reserves for fiscal years 2016 and 2015 (in thousands):
|
| | | | | | | | |
| | 2016 | | 2015 |
Beginning balance | | $ | 3,719 |
| | $ | 4,056 |
|
Warranty reserve of acquired businesses | | 3 |
| | — |
|
Provision for warranties | | 5,985 |
| | 4,929 |
|
Warranty payments and costs incurred | | (4,058 | ) | | (5,009 | ) |
Impact of changes in foreign currency rates | | (57 | ) | | (257 | ) |
Ending balance | | $ | 5,592 |
| | $ | 3,719 |
|
Revenue Recognition: The Company recognizes revenue when persuasive evidence of an arrangement exists, delivery has occurred, the sales price is fixed or determinable and collectability of the sales price is reasonably assured. For product sales, delivery does not occur until the passage of title and risk of loss have transferred to the customer (generally when products are shipped). Revenue from services and rental contracts are recognized when the services are provided or ratably over the contract term. Unearned revenue related to long-term customer contracts was $7.7 million and $8.3 million at August 31, 2016 and 2015, respectively. Customer sales are recorded net of allowances for returns and discounts, which are recognized as a deduction from sales at the time of sale. The Company commits to one-time or on-going trade discounts and promotions with customers that require the Company to estimate and accrue the ultimate costs of such programs. The Company generally does not require collateral or other security for receivables and provides for an allowance for doubtful accounts based on historical experience and a review of its existing receivables. Accounts receivable are stated net of an allowance for doubtful accounts of $7.8 million and $4.0 million at August 31, 2016 and 2015, respectively.
Shipping and Handling Costs: The Company records costs associated with shipping its products in cost of products sold.
Restructuring: The Company has committed to various restructuring initiatives including workforce reductions, plant consolidations to reduce manufacturing overhead, satellite office closures, the continued movement of production and product sourcing to low cost alternatives and the centralization and standardization of certain administrative functions. Total restructuring charges for these activities were $14.6 million in fiscal 2016 and impacted all segments. Liabilities for severance will be paid during the next twelve months, while future lease payments related to facilities vacated as a result of restructuring will be paid over the underlying remaining lease terms.
The following is a rollforward of fiscal 2016 restructuring activities, by segment, (in thousands):
|
| | | | | | | | | | | | | | | | | | | | |
| | Industrial | | Energy | | Engineered Solutions | | Corporate | | Total |
Balance as of August 31, 2015 | | $ | — |
| | $ | — |
| | $ | — |
| | $ | — |
| | $ | — |
|
Restructuring charges | | 3,158 |
| | 5,544 |
| | 5,411 |
| | 458 |
| | 14,571 |
|
Cash payments | | (1,772 | ) | | (2,345 | ) | | (3,199 | ) | | (203 | ) | | (7,519 | ) |
Non-cash uses of reserve | | (54 | ) | | (166 | ) | | (364 | ) | | (209 | ) | | (793 | ) |
Impact of changes in foreign currency rates | | 11 |
| | (12 | ) | | 15 |
| | — |
| | 14 |
|
Balance as of August 31, 2016 | | $ | 1,343 |
| | $ | 3,021 |
| | $ | 1,863 |
| | $ | 46 |
| | $ | 6,273 |
|
Research and Development Costs: Research and development costs consist primarily of an allocation of overall engineering and development resources and are expensed as incurred. Such costs incurred in the development of new products or significant improvements to existing products were $18.3 million, $17.7 million and $20.0 million in fiscal 2016, 2015 and 2014, respectively. The Company also incurs significant costs in connection with fulfilling custom orders and developing solutions for unique customer needs which are not included in these research and development expense totals.
Other Income/Expense: Other income and expense primarily consists of net foreign exchange transaction losses of $1.3 million, $0.1 million and $4.2 million in fiscal 2016, 2015 and 2014, respectively.
Financing Costs: Financing costs represent interest expense, financing fees and amortization of debt issuance costs, net of interest income. Interest income was $1.7 million, $1.9 million and $1.0 million for fiscal 2016, 2015 and 2014, respectively.
ACTUANT CORPORATION
NOTES TO CONSOLIDATED FINANCIAL STATEMENTS—(Continued)
Income Taxes: The provision for income taxes includes federal, state, local and non-U.S. taxes on income. Tax credits, primarily for non-U.S. earnings, are recognized as a reduction of the provision for income taxes in the year in which they are available for U.S. tax purposes. Deferred taxes are provided on temporary differences between assets and liabilities for financial and tax reporting purposes as measured by enacted tax rates expected to apply when temporary differences are settled or realized. Future tax benefits are recognized to the extent that realization of those benefits is considered to be more likely than not. A valuation allowance is established for deferred tax assets for which realization is not more likely than not of being realized. The Company has not provided for any residual U.S. income taxes on unremitted earnings of non-U.S. subsidiaries as such earnings are intended to be indefinitely reinvested. The Company recognizes interest and penalties related to unrecognized tax benefits in income tax expense.
Foreign Currency Translation: The financial statements of the Company’s foreign operations are translated into U.S. dollars using the exchange rate at each balance sheet date for assets and liabilities and an appropriate weighted average exchange rate for each applicable period for revenues and expenses. Translation adjustments are reflected in the consolidated balance sheets and consolidated statements of shareholders' equity caption “Accumulated Other Comprehensive Loss.”
Use of Estimates: The Company has recorded reserves for customer rebates, returns and discounts, doubtful accounts, inventory, incurred but not reported medical claims, environmental matters, warranty claims, workers compensation claims, product and non-product litigation and incentive compensation. These reserves require the use of estimates and judgment. The Company bases its estimates on historical experience and on various other assumptions that are believed to be reasonable under the circumstances. The Company believes that such estimates are made with consistent and appropriate assumptions. Actual results may differ from these estimates.
New Accounting Pronouncements
In November 2015, the FASB issued ASU 2015-17, Balance Sheet Classification of Deferred Taxes, which amends the existing guidance to require presentation of deferred tax assets and liabilities as non-current within a classified statement of financial position. This guidance was adopted, on a prospective basis, at September 1, 2015. Prior periods were not retrospectively adjusted.
In April 2015, the FASB issued ASU 2015-03, Simplifying the Presentation of Debt Issuance Costs, which includes amendments that require that debt issuance costs related to a recognized debt liability be presented in the balance sheet as a direct deduction from the carrying amount of that debt liability, consistent with debt discounts. Under the new rule, the recognition and measurement of debt issuance costs is not affected. This guidance is effective for fiscal years beginning on or after December 15, 2015. The adoption of this standard in fiscal 2017 is not expected to have a material impact on the financial statements of the Company.
In September 2015, the FASB issued ASU 2015-16, Simplifying the Accounting for Measurement-Period Adjustments, which eliminates the requirement to retrospectively account for changes to provisional amounts initially recorded in a business acquisition opening balance sheet. This standard is effective for fiscal years beginning after December 15, 2015 (fiscal 2017 for the Company), including interim periods within fiscal years. The adoption of this standard is not expected to have a material impact on the financial statements of the Company.
In March 2016, the FASB issued ASU 2016-09, "Stock Compensation: Improvements to Employee Share-Based Payment Accounting," which will simplify several aspects of accounting for share-based payment transactions. The guidance will require, among other items, that all excess tax deficiencies or benefits be recorded as income tax expense or benefit in the statement of earnings, and not in additional paid-in capital (shareholder's equity). This guidance is effective for fiscal years beginning after December 15, 2016 (fiscal 2018 for the Company), and interim periods within those annual periods. The Company is currently evaluating the impact of adopting this standard.
In May 2014, the FASB issued ASU 2014-09, Revenue from Contracts with Customers. Under ASU 2014-09 and subsequent updates included in ASU 2016-10 and ASU 2016-12, an entity will recognize revenue when it transfers promised goods or services to customers in an amount that reflects what it expects in exchange for the goods or services. It also requires more detailed disclosures to enable users of financial statements to understand the nature, amount, timing, and uncertainty of revenue and cash flows arising from contracts with customers. This guidance is effective for fiscal years beginning on or after December 15, 2017 (fiscal 2019 for the Company). The Company is currently evaluating the impact of adopting this standard.
In February 2016, the FASB issued ASU 2016-02, Leases which requires recognizing all lease transactions (with terms in excess of 12 months) on the balance sheet as a lease liability and a right-of-use asset. This new rule is effective for fiscal years beginning after December 15, 2018 (fiscal 2020 of the Company), including interim periods within those fiscal years. Upon
ACTUANT CORPORATION
NOTES TO CONSOLIDATED FINANCIAL STATEMENTS—(Continued)
adoption, the lessee will apply the new standard retrospectively to all periods presented or retrospectively using a cumulative effect adjustment in the year of adoption. The Company is currently evaluating the impact of adopting this standard.
In August 2016, the FASB issued ASU 2016‑15, Statement of Cash Flows (Topic 230), Classification of Certain Cash Receipts and Cash Payments, to address how certain cash receipts and cash payments are presented and classified in the statement of cash flows. This update addresses eight specific cash flow issues with the objective of reducing the existing diversity in practice. This guidance is effective for fiscal years beginning after December 15, 2017 (fiscal 2019 of the Company), including interim periods within those fiscal years. This update will require adoption on a retrospective basis unless it is impracticable to apply. The Company is currently evaluating the impact of adopting this standard.
Note 2. Acquisitions
The Company completed three business acquisitions during the last three years. These acquisitions resulted in the recognition of goodwill in the Company’s consolidated financial statements because the purchase prices reflected the future earnings and cash flow potential of these companies, as well as the complementary strategic fit and resulting synergies these businesses bring to existing operations. The Company incurred acquisition transaction costs of $2.7 million, $0.1 million and $0.5 million in fiscal 2016, 2015 and 2014, respectively (included in selling, administrative and engineering expenses in the consolidated statement of operations).
The Company makes an initial allocation of the purchase price, at the date of acquisition, based upon the fair value of the acquired assets and assumed liabilities. The Company obtains this information during due diligence and through other sources. If additional information is obtained about these assets and liabilities within the measurement period (not to exceed one year from the date of acquisition), the Company will refine its estimates of fair value and adjust the purchase price allocation.
Fiscal 2016 Acquisitions:
The Company acquired the stock of Larzep, S.A. ("Larzep") on February 17, 2016 for a purchase price of $15.9 million, net of cash acquired. This Industrial segment tuck-in acquisition is headquartered in Mallabia, Spain and is a supplier of hydraulic tools and solutions. The preliminary purchase price allocation resulted in $9.7 million of goodwill (which is not deductible for tax purposes) and $4.8 million of intangible assets, including $3.6 million of customer relationships and $1.2 million of tradenames.
The Company also acquired the assets of the Middle East, Caspian and the North African business of FourQuest Energy Inc. ("Pipeline and Process Services") for $65.5 million on March 30, 2016. This Hydratight tuck-in acquisition was funded with existing cash and expands the geographic presence and service offerings of the Energy segment, including pipeline pre-commissioning, engineering, chemical cleaning and leak testing. The preliminary purchase price resulted in $36.2 million of goodwill (which is not deductible for tax purposes) and $8.7 million of intangible assets, including $8.0 million of customer relationships and $0.7 million of non-compete agreements.
Total sales in fiscal 2016 for these two acquired business were $19.1 million. The following table summarizes the estimated fair value of the assets acquired and the liabilities assumed, at the date of acquisition, for these businesses (in thousands):
|
| | | |
| Total |
Accounts receivable, net | $ | 20,439 |
|
Inventories | 1,997 |
|
Other assets | 505 |
|
Property, plant & equipment | 12,315 |
|
Goodwill | 45,967 |
|
Other intangible assets | 13,517 |
|
Trade accounts payable | (8,938 | ) |
Other liabilities | (1,225 | ) |
Deferred income tax liability | (2,661 | ) |
Cash paid, net of cash acquired | $ | 81,916 |
|
ACTUANT CORPORATION
NOTES TO CONSOLIDATED FINANCIAL STATEMENTS—(Continued)
Fiscal 2014 Acquisition:
The Company acquired Hayes Industries Ltd. ("Hayes") on May 23, 2014 for $30.5 million. This Industrial segment acquisition is headquartered in Sugar Land, Texas and maintains a leading position in the concrete tensioning market. Its products include patented encapsulated anchor systems, wedges and customized extruded cables. The purchase price allocation resulted in the recognition of $14.3 million of goodwill (which is deductible for tax purposes) and $10.6 million of intangible assets, including $5.0 million of patents, $3.3 million of customer relationships, $2.0 million of tradenames and $0.3 million for non-compete agreements.
The following unaudited pro forma operating results give effect to these three acquisitions as though the transactions and related financing activities had occurred on September 1, 2013 (in thousands, except per share amounts).
|
| | | | | | | | | | | | |
| | | | |
| | 2016 | | 2015 | | 2014 |
Net Sales | | | | | | |
As reported | | $ | 1,149,410 |
| | $ | 1,249,254 |
| | $ | 1,399,862 |
|
Pro forma | | 1,175,304 |
| | 1,275,965 |
| | 1,450,014 |
|
Earnings (loss) from continuing operations | | | | | | |
As reported | | $ | (105,174 | ) | | $ | 19,872 |
| | $ | 141,453 |
|
Pro forma | | (100,927 | ) | | 20,553 |
| | 142,124 |
|
Basic earnings (loss) per share from continuing operations | | | | | | |
As reported | | $ | (1.78 | ) | | $ | 0.32 |
| | $ | 1.99 |
|
Pro forma | | (1.71 | ) | | 0.34 |
| | 2.00 |
|
Diluted earnings (loss) per share from continuing operations | | | | | | |
As reported | | $ | (1.78 | ) | | $ | 0.32 |
| | $ | 1.95 |
|
Pro forma | | (1.71 | ) | | 0.33 |
| | 1.96 |
|
Note 3. Discontinued Operations and Divestitures
Fiscal 2016 Product Line Divestiture
On August 25, 2016, the Company completed the divestiture of its Sanlo business (Engineered Solutions segment) for $9.7 million in cash, net of transaction costs. This divestiture resulted in a $5.1 million pre-tax loss, but a $1.6 million gain net of tax. The results of the Sanlo business (sales of approximately $11 million in fiscal 2016) are not material to the consolidated financial results and are included in continuing operations.
Fiscal 2014 Product Line Divestiture and Discontinued Operations
On June 13, 2014, the Company completed the divestiture of its Recreational Vehicle ("RV") business (Engineered Solutions segment) for $36.5 million in cash. This product line divestiture resulted in a $13.5 million pre-tax gain, $2.8 million net of tax. The results of the RV business (sales of approximately $22 million in fiscal 2014) are not material to the consolidated financial results and are included in continuing operations.
The former Electrical segment designed, manufactured and distributed a broad range of electrical products to the retail DIY, wholesale, OEM, solar, utility and marine markets. On December 13, 2013, the Company completed the sale of the Electrical segment for net cash proceeds of $252.4 million, which resulted in a pre-tax gain of $34.5 million, $26.3 million net of tax. Net sales of the former Electrical segment in fiscal 2014, prior to the divestiture, were $72.1 million.
Note 4. Goodwill, Intangible Assets and Long-Lived Assets
Fiscal 2016 Interim Impairment Charge
The prolonged unfavorable conditions in the global oil & gas markets, including additional cuts in projected capital spending by energy customers, reduced exploration, drilling and commissioning activities and excess capacity in the industry (given continued low oil & gas prices) were expected to have an adverse impact on the future financial results of the Cortland and Viking businesses. Accordingly, during the second quarter of fiscal 2016, the Company recognized a $140.9 million impairment charge (as a result of lower projected future sales and profits) related to the Cortland and Viking businesses.
The maximatecc business (Engineered Solutions segment), manufactures severe-duty electronic instrumentation including displays and clusters, machine controls and sensors. Weakness in off-highway vehicle and agricultural markets, coupled with
ACTUANT CORPORATION
NOTES TO CONSOLIDATED FINANCIAL STATEMENTS—(Continued)
challenging overall industrial fundamentals, recent reductions in OEM customer build rates and production schedules (in order to reduce inventory levels) and delays in the start of production by certain European OEMs for new or updated design models resulted in reduced sales and profitability of the maximatecc business. As a result of lower projected sales and profits, during the second quarter of fiscal 2016, the Company recognized a $45.7 million impairment charge related to the goodwill and intangible assets of the maximatecc business.
A summary of the second quarter fiscal 2016 impairment charge by reporting unit is as follows (in thousands):
|
| | | | | | | | | | | | | | | |
| Cortland | | Viking | | maximatecc | | Total |
Goodwill | $ | 34,502 |
| | $ | 39,099 |
| | $ | 44,521 |
| | $ | 118,122 |
|
Indefinite lived intangible assets | 2,211 |
| | 13,289 |
| | 1,153 |
| | 16,653 |
|
Amortizable intangible assets | — |
| | 27,952 |
| | — |
| | 27,952 |
|
Fixed assets | — |
| | 23,784 |
| | — |
| | 23,784 |
|
| $ | 36,713 |
| | $ | 104,124 |
| | $ | 45,674 |
| | $ | 186,511 |
|
Fiscal 2015 Impairment Charge
The dramatic decline in oil prices in 2015 caused a slowdown in upstream oil & gas activity as asset owners hesitated on starting new oil & gas exploration drilling and development projects, while certain existing projects were deferred or canceled and capital spending was reduced. As a result of these unfavorable market conditions, in fiscal 2015 the Company recognized an $84.4 million impairment charge related to the write-down of goodwill and indefinite lived intangible assets of the Cortland and Viking businesses. The impairment charge consisted of a $78.5 million impairment of goodwill and a $6.4 million impairment of indefinite lived intangible assets (tradenames).
Changes in the gross carrying value of intangible assets and goodwill result from changes in foreign currency exchange rates, business acquisitions, divestitures and impairment charges. The changes in the carrying amount of goodwill for the years ended August 31, 2016 and 2015 are as follows (in thousands):
|
| | | | | | | | | | | | | | | | |
| | Industrial | | Energy | | Engineered Solutions | | Total |
Balance as of August 31, 2014 | | $ | 100,266 |
| | $ | 350,627 |
| | $ | 291,877 |
| | $ | 742,770 |
|
Purchase accounting adjustments (Hayes) | | (3,244 | ) | | — |
| | — |
| | (3,244 | ) |
Impairment charge | | — |
| | (78,530 | ) | | — |
| | (78,530 | ) |
Impact of changes in foreign currency rates | | (4,915 | ) | | (35,647 | ) | | (12,178 | ) | | (52,740 | ) |
Balance as of August 31, 2015 | | 92,107 |
| | 236,450 |
| | 279,699 |
| | 608,256 |
|
Business acquisitions | | 9,726 |
| | 36,241 |
| | — |
| | 45,967 |
|
Impairment charge | | — |
| | (73,919 | ) | | (44,543 | ) | | (118,462 | ) |
Business divestiture (Sanlo) | | — |
| | — |
| | (3,778 | ) | | (3,778 | ) |
Impact of changes in foreign currency rates | | (94 | ) | | (11,451 | ) | | (1,162 | ) | | (12,707 | ) |
Balance as of August 31, 2016 | | $ | 101,739 |
| | $ | 187,321 |
| | $ | 230,216 |
| | $ | 519,276 |
|
ACTUANT CORPORATION
NOTES TO CONSOLIDATED FINANCIAL STATEMENTS—(Continued)
The gross carrying amount and accumulated amortization of the Company’s intangible assets are as follows (in thousands):
|
| | | | | | | | | | | | | | | | | | | | | | | | | | |
| | Weighted Average Amortization Period (Year) | | August 31, 2016 | | August 31, 2015 |
| | Gross | | Accumulated Amortization | | Net Book Value | | Gross | | Accumulated Amortization | | Net Book Value |
Amortizable intangible assets: | | | | | | | | | | | | | | |
Customer relationships | | 14 | | $ | 292,671 |
| | $ | 166,252 |
| | $ | 126,419 |
| | $ | 302,518 |
| | $ | 132,007 |
| | $ | 170,511 |
|
Patents | | 10 | | 30,296 |
| | 22,233 |
| | 8,063 |
| | 30,899 |
| | 19,928 |
| | 10,971 |
|
Trademarks and tradenames | | 18 | | 21,283 |
| | 7,936 |
| | 13,347 |
| | 21,604 |
| | 7,055 |
| | 14,549 |
|
Non-compete agreements & other | | 3 | | 6,627 |
| | 5,890 |
| | 737 |
| | 6,790 |
| | 6,496 |
| | 294 |
|
Indefinite lived intangible assets: | | | | | | | | | | | | | | |
Tradenames | | | | 90,909 |
| | — |
| | 90,909 |
| | 112,437 |
| | — |
| | 112,437 |
|
| | | | $ | 441,786 |
| | $ | 202,311 |
| | $ | 239,475 |
| | $ | 474,248 |
| | $ | 165,486 |
| | $ | 308,762 |
|
Amortization expense for future years is estimated to be: $20.2 million in fiscal year 2017, $19.9 million in fiscal 2018, $19.7 million in fiscal 2019, $19.0 million in fiscal 2020, $17.9 million in fiscal 2021 and $51.9 million in aggregate thereafter. The future amortization expense amounts represent estimates and may be impacted by future acquisitions, divestitures or changes in foreign currency exchange rates.
Note 5. Debt
The following is a summary of the Company’s long-term indebtedness (in thousands):
|
| | | | | | | |
| August 31, |
| 2016 | | 2015 |
Senior Credit Facility | | | |
Revolver ($600 million) | $ | — |
| | $ | — |
|
Term Loan | 296,250 |
| | 300,000 |
|
| 296,250 |
| | 300,000 |
|
5.625% Senior Notes | 288,059 |
| | 288,059 |
|
Total Senior Indebtedness | 584,309 |
| | 588,059 |
|
Less: current maturities of long-term debt | (18,750 | ) | | (3,750 | ) |
Total long-term debt, less current maturities | $ | 565,559 |
| | $ | 584,309 |
|
The Company’s Senior Credit Facility matures on May 8, 2020, provides a $600 million revolver, a $300 million term loan and a $450 million expansion option, subject to certain conditions. Borrowings are subject to a pricing grid, which can result in increases or decreases to the borrowing spread, depending on the Company’s leverage ratio, ranging from a spread of 1.00% to 2.25% in the case of loans bearing interest at LIBOR and from 0.00% to 1.25% in the case of loans bearing interest at the base rate. As of August 31, 2016, the borrowing spread on LIBOR based borrowings was 2.00% (aggregating to a 2.50% variable rate borrowing cost). In addition, a non-use fee is payable quarterly on the average unused credit line under the revolver ranging from 0.15% to 0.35% per annum. As of August 31, 2016, the unused credit line under the revolver was $592.1 million, of which $180.0 million was available for borrowings. Quarterly term loan principal payments of $3.8 million began on June 30, 2016, increase to $7.5 million per quarter on June 30, 2017, with the remaining principal due at maturity. The Senior Credit Facility, which is secured by substantially all of the Company’s domestic personal property assets, also contains customary limits and restrictions concerning investments, sales of assets, liens on assets, dividends and other payments. The two financial covenants included in the Senior Credit Facility agreement are a maximum leverage ratio of 3.75:1 and a minimum interest coverage ratio of 3.50:1. The Company was in compliance with all financial covenants at August 31, 2016.
On April 16, 2012, the Company issued $300 million of 5.625% Senior Notes due 2022 (the “Senior Notes”). The Senior Notes require no principal installments prior to their June 15, 2022 maturity, require semiannual interest payments in December and June of each year and contain certain financial and non-financial covenants. The Senior Notes include a call feature that allows the Company to repurchase them anytime on or after June 15, 2017 at stated redemption prices (ranging from 100.0% to 102.8%), plus accrued and unpaid interest. As required under the indenture governing the Senior Notes, on June 19, 2015, the Company initiated an offer to repurchase, at par value, up to $165 million of Senior Notes representing the non-reinvested
ACTUANT CORPORATION
NOTES TO CONSOLIDATED FINANCIAL STATEMENTS—(Continued)
proceeds from the fiscal 2014 business divestitures. Prior to its expiration, the Company repurchased $11.9 million of Senior Notes pursuant to this tender offer in the fourth quarter of fiscal 2015.
The Company made cash interest payments of $27.2 million, $24.8 million and $21.0 million in fiscal 2016, 2015 and 2014, respectively.
Note 6. Fair Value Measurements
The Company assesses the inputs used to measure the fair value of financial assets and liabilities using a three-tier hierarchy. Level 1 inputs include quoted prices for identical instruments and are the most observable. Level 2 inputs include quoted prices for similar assets and observable inputs such as interest rates, foreign currency exchange rates, commodity rates and yield curves. Level 3 inputs are not observable in the market and include management’s own judgments about the assumptions market participants would use in pricing the asset or liability.
The fair value of the Company’s cash and cash equivalents, foreign currency derivatives, accounts receivable, accounts payable and its variable rate long-term debt approximated book value at August 31, 2016 and 2015 due to their short-term nature and the fact that the interest rates approximated year-end market rates. The fair value of the Company’s outstanding 5.625% Senior Notes was $299.6 million and $287.3 million at August 31, 2016 and 2015, respectively. The fair value of the Senior Notes was based on quoted inactive market prices and are therefore classified as Level 2 within the valuation hierarchy.
Note 7. Derivatives
All derivatives are recognized in the balance sheet at their estimated fair value. On the date the Company enters into a derivative contract, it designates the derivative as a hedge of a recognized asset or liability (fair value hedge) or a hedge of a forecasted transaction or of the variability of cash flows to be received or paid related to a recognized asset or liability (cash flow hedge). The Company does not enter into derivatives for speculative purposes. Changes in the value of fair value hedges and non-designated hedges are recorded in earnings along with the gain or loss on the hedged asset or liability, while changes in the value of cash flow hedges are recorded in accumulated other comprehensive loss, until earnings are affected by the variability of cash flows. The fair value of outstanding foreign currency derivatives was a liability of $0.7 million and $0.2 million at August 31, 2016 and 2015, respectively.
The Company is exposed to market risk for changes in foreign currency exchange rates due to the global nature of its operations. In order to manage this risk the Company has hedged portions of its forecasted inventory purchases and other cash flows that are denominated in non-functional currencies (cash flow hedges). As of August 31, 2016 there were no cash flow hedges outstanding, while the U.S. dollar equivalent notional value of these foreign currency forward contracts was $0.5 million at August 31, 2015.
The Company also utilizes forward foreign currency exchange contracts to reduce the exchange rate risk associated with recognized non-functional currency balances. The effects of changes in exchange rates are reflected concurrently in earnings for both the fair value of the foreign currency exchange contracts and the related non-functional currency asset or liability. The U.S. dollar equivalent notional value of these short duration foreign currency forward contracts was $143.4 million and $170.7 million, at August 31, 2016 and 2015, respectively. Net foreign currency losses related to these derivative instruments were $1.5 million, $0.1 million and $13.5 million in fiscal 2016, 2015 and 2014, respectively. These derivative gains and losses offset foreign currency gains and losses from the related revaluation of non-functional currency assets and liabilities (amounts included in other expense in the consolidated statement of operations).
Note 8. Leases
The Company leases certain facilities, computers, equipment and vehicles under various lease agreements generally over periods of one to twenty years. Under most arrangements, the Company pays the property taxes, insurance, maintenance and expenses related to the leased property. Many of the leases include provisions that enable the Company to renew the lease based upon fair value rental rates on the date of expiration of the initial lease.
As of August 31, 2016, future obligations under non-cancelable operating leases were as follows: $32.9 million in fiscal 2017; $27.1 million in fiscal 2018; $23.6 million in fiscal 2019; $19.9 million in fiscal 2020; $14.4 million in fiscal 2021; and $45.1 million in aggregate thereafter. Total rental expense under operating leases was $37.6 million, $35.7 million and $31.6 million in fiscal 2016, 2015 and 2014, respectively. In fiscal 2016, the Company completed the sale leaseback of certain facilities and Energy segment rental assets for total proceeds of $7.0 million. In fiscal 2014, the Company also completed the sale leaseback of certain rental assets of the Viking business for proceeds of $41.0 million.
ACTUANT CORPORATION
NOTES TO CONSOLIDATED FINANCIAL STATEMENTS—(Continued)
As discussed in Note 14, “Contingencies and Litigation” the Company remains contingently liable for lease payments under leases of businesses that it previously divested or spun off.
Note 9. Employee Benefit Plans
U.S. Defined Benefit Pension Plans
All of the U.S. defined benefit pension plans are frozen, and as a result, plan participants no longer earn additional benefits. The following table provides detail of changes in the projected benefit obligations, the fair value of plan assets and the funded status of the Company’s U.S. defined benefit pension plans as of the respective August 31 measurement date (in thousands):
|
| | | | | | | |
| 2016 | | 2015 |
Reconciliation of benefit obligations: | | | |
Benefit obligation at beginning of year | $ | 45,612 |
| | $ | 47,545 |
|
Interest cost | 1,970 |
| | 1,920 |
|
Actuarial (gain) loss | 5,604 |
| | (170 | ) |
Benefits paid | (2,777 | ) | | (3,683 | ) |
Benefit obligation at end of year | $ | 50,409 |
| | $ | 45,612 |
|
Reconciliation of plan assets: | | | |
Fair value of plan assets at beginning of year | $ | 39,181 |
| | $ | 44,642 |
|
Actual return on plan assets | 2,687 |
| | (2,088 | ) |
Company contributions | 398 |
| | 310 |
|
Benefits paid from plan assets | (2,777 | ) | | (3,683 | ) |
Fair value of plan assets at end of year | 39,489 |
| | 39,181 |
|
Funded status of the plans (underfunded) | $ | (10,920 | ) | | $ | (6,431 | ) |
The following table provides detail on the Company’s domestic net periodic benefit costs (in thousands):
|
| | | | | | | | | | | |
| Year ended August 31, |
| 2016 | | 2015 | | 2014 |
Interest cost | $ | 1,970 |
| | $ | 1,920 |
| | $ | 2,146 |
|
Expected return on assets | (2,997 | ) | | (3,143 | ) | | (2,959 | ) |
Amortization of actuarial loss | 837 |
| | 828 |
| | 667 |
|
Net benefit cost (income) | $ | (190 | ) | | $ | (395 | ) | | $ | (146 | ) |
At August 31, 2016 and 2015, $18.4 million and $15.2 million, respectively, of pension plan actuarial losses, which have not yet been recognized in net periodic benefit cost, were included in accumulated other comprehensive loss, net of income taxes. During fiscal 2017, $0.7 million of these actuarial losses are expected to be recognized in net periodic benefit cost.
Weighted-average assumptions used to determine U.S. pension plan obligations as of August 31 and weighted-average assumptions used to determine net periodic benefit cost for the years ended August 31 are as follows:
|
| | | | | | | | |
| 2016 | | 2015 | | 2014 |
Assumptions for benefit obligations: | | | | | |
Discount rate | 3.45 | % | | 4.45 | % | | 4.15 | % |
Assumptions for net periodic benefit cost: | | | | | |
Discount rate | 4.45 | % | | 4.15 | % | | 4.90 | % |
Expected return on plan assets | 7.40 | % | | 7.50 | % | | 7.65 | % |
The Company employs a total return on investment approach for its pension plan assets whereby a mix of equity and fixed income investments are used to maximize the long-term return for plan assets, at a prudent level of risk. The investment portfolio contains a blend of equity and fixed income investments. Within the equity allocation, a blend of growth and value investments is maintained in a variety of market capitalizations and diversified between U.S. and non-U.S. stocks. The Company’s targeted asset allocation as a percentage of total plan assets is 60% - 80% in equity securities, with the remainder invested in fixed income securities and cash. Cash balances are maintained at levels adequate to meet near-term plan expenses
ACTUANT CORPORATION
NOTES TO CONSOLIDATED FINANCIAL STATEMENTS—(Continued)
and benefit payments. Investment risk is measured and monitored on an ongoing basis. At August 31, 2016, the Company’s overall expected long-term rate of return for assets in U.S. pension plans was 7.15%. The expected long-term rate of return is based on the portfolio as a whole and not on the sum of the returns on individual asset categories. The target return is based on historical returns adjusted to reflect the current view of the long-term investment market.
The fair value of all U.S. pension plan assets is determined based on quoted market prices and therefore all plan assets are determined based on Level 1 inputs, except for fixed income securities which are valued based on Level 2 inputs, as defined in Note 6, “Fair Value Measurements.” The U.S. pension plan investment allocations by asset category were as follows (in thousands):
|
| | | | | | | | | | | | | | |
| | Year Ended August 31, |
| | 2016 | | % | | 2015 | | % |
Cash and cash equivalents | | $ | 347 |
| | 0.9 | % | | $ | 314 |
| | 0.8 | % |
Fixed income securities: | | | | | | | | |
Corporate bonds | | 8,372 |
| | 21.2 |
| | 9,481 |
| | 24.2 |
|
Mutual funds | | 3,351 |
| | 8.5 |
| | 3,100 |
| | 7.9 |
|
| | 11,723 |
| | 29.7 |
| | 12,581 |
| | 32.1 |
|
Equity securities: | | | | | | | | |
Mutual funds | | 27,419 |
| | 69.4 |
| | 26,286 |
| | 67.1 |
|
Total plan assets | | $ | 39,489 |
| | 100.0 | % | | $ | 39,181 |
| | 100.0 | % |
Projected benefit payments from plan assets to participants in the Company’s U.S. pension plans are $2.8 million for fiscal 2017, $2.9 million for both fiscal 2018 and 2019, $3.0 million for both fiscal 2020 and 2021 and $15.0 million in aggregate for the following five years.
Foreign Defined Benefit Pension Plans
The Company has ten foreign defined benefit pension plans which cover certain existing and former employees of businesses outside the U.S. Most of the participants in the foreign defined benefit pension plans are current employees and are earning additional benefits. The funded status of these plans is summarized as follows (in thousands):
|
| | | | | | | | |
| | August 31, |
| | 2016 | | 2015 |
Benefit obligation | | $ | 16,808 |
| | $ | 14,255 |
|
Fair value of plan assets | | 8,502 |
| | 8,675 |
|
Funded status of plans (underfunded) | | $ | (8,306 | ) | | $ | (5,580 | ) |
Net periodic benefit cost for these foreign plans was $0.7 million, $1.0 million and $1.3 million in fiscal 2016, 2015 and 2014, respectively. The weighted average discount rate utilized for determining the benefit obligation at August 31, 2016 and 2015 was 1.9% and 3.1%, respectively. The plan assets of these foreign pension plans consist primarily of participating units in fixed income and equity securities and insurance contracts. The Company’s overall expected long-term rate of return on these investments is 4.6%. During fiscal 2017, the Company anticipates contributing $0.4 million to these pension plans.
Projected benefit payments from plan assets to participants in the these foreign plans are $0.5 million for fiscal 2017, $1.3 million for fiscal 2018, $0.3 million for fiscal 2019, $1.0 million for fiscal 2020, $0.9 million for fiscal 2021 and $3.3 million in aggregate for the following five years.
Other Postretirement Health Benefit Plans
The Company provides other postretirement health benefits (“OPEB”) to certain existing and former employees of domestic businesses it acquired, who were entitled to such benefits prior to acquisition. These unfunded plans had a benefit obligation of $4.0 million and $3.5 million at August 31, 2016 and 2015, respectively. These obligations are determined utilizing assumptions consistent with those used for U.S. pension plans and a health care cost trend rate of 7.5%, trending downward to 5.0% by the year 2022, and remaining level thereafter. Net periodic benefit (income) costs for the other postretirement benefits was less than $0.1 million for each of the fiscal years ended August 31, 2016, 2015 and 2014. Benefit
ACTUANT CORPORATION
NOTES TO CONSOLIDATED FINANCIAL STATEMENTS—(Continued)
payments from the plan are funded through participant contributions and Company contributions and are projected to be $0.3 million in fiscal 2017.
Defined Contribution Benefit Plans
The Company maintains a 401(k) plan for substantially all full time U.S. employees (the “401(k) Plan”). Under plan provisions, the Company can fund either cash or issue new shares of Class A common stock for its contributions. Amounts are allocated to accounts set aside for each employee’s retirement. Employees generally may contribute up to 50% of their compensation to individual accounts within the 401(k) Plan. While contributions vary, the Company generally makes core contributions to employee accounts equal to 3% of each employee’s eligible annual cash compensation, subject to IRS limitations. In addition, the Company matches approximately 25% of each employee’s contribution up to 6% of the employee’s eligible compensation. The Company also maintains a Restoration Plan that allows eligible highly compensated employees (as defined by the Internal Revenue Code) to receive a core contribution as if no IRS limits were in place. Company contributions to the Restoration Plan are made in the form of Actuant common stock and are contributed into each eligible participant’s deferred compensation plan account. Expense recognized related to the 401(k) plan totaled $4.4 million, $4.3 million and $4.5 million for the years ended August 31, 2016, 2015 and 2014, respectively.
In addition to the 401(k) plan, the Company sponsors a nonqualified supplemental executive retirement plan (“the SERP Plan”). The unfunded SERP Plan is an unfunded defined contribution plan that covers certain executive employees and has an annual contribution formula based on age and years of service (with Company contributions ranging from 3% to 6% of eligible wages). This unfunded plan had a $1.6 million obligation at both August 31, 2016 and 2015, respectively. Expense recognized in fiscal 2016, 2015 and 2014 for the SERP Plan was $0.3 million, $0.3 million, and $0.4 million respectively.
Deferred Compensation Plan
The Company maintains a deferred compensation plan to allow eligible U.S. employees to defer receipt of current cash compensation in order to provide future savings benefits. Eligibility is limited to employees that earn compensation that exceeds certain pre-defined levels. Participants have the option to invest their deferrals in a fixed income investment, in Company common stock, or a combination of the two. The fixed income portion of the plan is unfunded, and therefore all compensation deferred under the plan is held by the Company and commingled with its general assets. Liabilities of $22.2 million and $22.7 million are included in the consolidated balance sheets at August 31, 2016 and 2015, respectively, to reflect the unfunded portion of the deferred compensation liability. The Company recorded expense in "Financing costs, net" of $1.6 million, $1.8 million and $1.7 million for the years ended August 31, 2016, 2015 and 2014, respectively, for non-funded interest on participant deferrals in the fixed income investment option. Company common stock contributions to fund the plan are held in a rabbi trust, accounted for in a manner similar to treasury stock and are recorded at cost in “Stock held in trust” within shareholders’ equity with the corresponding deferred compensation liability also recorded within shareholders’ equity. Since no investment diversification is permitted within the trust, changes in fair value of Actuant common stock are not recognized.
Note 10. Income Taxes
Income tax expense (benefit) from continuing operations is summarized as follows (in thousands):
|
| | | | | | | | | | | |
| Year Ended August 31, |
| 2016 | | 2015 | | 2014 |
Current: | | | | | |
Federal | $ | 2,205 |
| | $ | (126 | ) | | $ | 23,211 |
|
Foreign | 11,838 |
| | 21,200 |
| | 9,059 |
|
State | 912 |
| | (1,616 | ) | | (657 | ) |
| 14,955 |
| | 19,458 |
| | 31,613 |
|
Deferred: | | | | | |
Federal | (12,470 | ) | | (4,416 | ) | | 4,224 |
|
Foreign | (23,797 | ) | | (9,199 | ) | | (4,130 | ) |
State | (3,858 | ) | | (324 | ) | | 866 |
|
| (40,125 | ) | | (13,939 | ) | | 960 |
|
Income tax expense (benefit) | $ | (25,170 | ) | | $ | 5,519 |
| | $ | 32,573 |
|
ACTUANT CORPORATION
NOTES TO CONSOLIDATED FINANCIAL STATEMENTS—(Continued)
Income tax expense from continuing operations recognized in the accompanying consolidated statements of operations differs from the amounts computed by applying the federal income tax rate to earnings from continuing operations before income tax expense. A reconciliation of income taxes at the federal statutory rate to the effective tax rate is summarized in the following table:
|
| | | | | | | | |
| Year Ended August 31, |
| 2016 | | 2015 | | 2014 |
Federal statutory rate | 35.0 | % | | 35.0 | % | | 35.0 | % |
State income taxes, net of Federal effect | 1.2 |
| | (0.2 | ) | | 0.8 |
|
Net effects of foreign tax rate differential and credits (1) | 1.6 |
| | (58.4 | ) | | (10.5 | ) |
Domestic manufacturing deduction | 0.3 |
| | (5.1 | ) | | (1.0 | ) |
Foreign branch currency losses | 4.9 |
| | — |
| | — |
|
Goodwill impairment (2) | (27.0 | ) | | 78.6 |
| | — |
|
Valuation allowance additions and releases (3) | (0.7 | ) | | 15.5 |
| | (8.0 | ) |
Changes in liability for unrecognized tax benefits (4) | (0.9 | ) | | (42.1 | ) | | 3.2 |
|
Change in income tax accounting method, net | — |
| | — |
| | (5.6 | ) |
Business divestitures | 3.9 |
| | — |
| | 3.0 |
|
Other items | 1.0 |
| | (1.6 | ) | | 1.8 |
|
Effective income tax rate | 19.3 | % | | 21.7 | % | | 18.7 | % |
(1) During fiscal 2015, the Company generated $10.0 million of foreign tax credits, the result of a non-recurring non-permanent loan from a foreign subsidiary (which were utilized to reduce fiscal 2015 tax obligations) and had a higher proportion of non-U.S. earnings.
(2) Fiscal 2016 and fiscal 2015 net earnings include a $186.5 million and $84.4 million, respectively, impairment of goodwill and intangible assets, of which $68.0 million and $6.3 million, respectively, are deductible for income tax purposes.
(3) Additional valuation allowances of $5.7 million were established in fiscal 2015 due to uncertainty regarding utilization of foreign operating loss carryforwards, which were partially offset by the reversal of $2.3 million of previously established reserves.
(4) The liability for unrecognized tax benefits decreased $9.5 million in fiscal 2015 primarily due to settlements and lapsing of tax audit statutes.
Temporary differences and carryforwards that gave rise to deferred tax assets and liabilities include the following items (in thousands):
|
| | | | | | | |
| August 31, |
| 2016 | | 2015 |
Deferred income tax assets: | | | |
Operating loss and tax credit carryforwards | $ | 36,761 |
| | $ | 19,419 |
|
Compensation related liabilities | 25,086 |
| | 27,047 |
|
Postretirement benefits | 8,727 |
| | 6,778 |
|
Inventory | 3,044 |
| | 3,253 |
|
Book reserves and other items | 8,317 |
| | 11,976 |
|
Total deferred income tax assets | 81,935 |
| | 68,473 |
|
Valuation allowance | (8,147 | ) | | (8,053 | ) |
Net deferred income tax assets | 73,788 |
| | 60,420 |
|
Deferred income tax liabilities: | | | |
Depreciation and amortization | (83,020 | ) | | (110,763 | ) |
Other items | (5,493 | ) | | (4,539 | ) |
Deferred income tax liabilities | (88,513 | ) | | (115,302 | ) |
Net deferred income tax liability | $ | (14,725 | ) | | $ | (54,882 | ) |
The Company has $58.3 million of state loss carryforwards, which are available to reduce future state tax liabilities. These state net operating loss carryforwards expire at various times through 2036. The Company also has $105.4 million of foreign loss carryforwards which are available to reduce certain future foreign tax liabilities. Approximately one-half of the
ACTUANT CORPORATION
NOTES TO CONSOLIDATED FINANCIAL STATEMENTS—(Continued)
foreign loss carryforwards are not subject to any expiration dates, while the other balances expire at various times through 2026. The valuation allowance represents a reserve for deferred tax assets, including loss carryforwards, for which utilization is uncertain.
Changes in the Company’s gross liability for unrecognized tax benefits, excluding interest and penalties, are as follows (in thousands):
|
| | | | | | | | | | | |
| 2016 | | 2015 | | 2014 |
Beginning balance | $ | 29,924 |
| | $ | 39,509 |
| | $ | 18,006 |
|
Increases based on tax positions related to the current year | 1,050 |
| | 2,183 |
| | 28,053 |
|
Increase for tax positions taken in a prior period | 475 |
| | 8,935 |
| | — |
|
Decrease for tax positions taken in a prior period | — |
| | (633 | ) | | — |
|
Decrease due to lapse of statute of limitations | (1,027 | ) | | (4,464 | ) | | (7,030 | ) |
Decrease due to settlements | — |
| | (14,180 | ) | | — |
|
Changes in foreign currency exchange rates | (1,248 | ) | | (1,426 | ) | | 480 |
|
Ending balance | $ | 29,174 |
| | $ | 29,924 |
| | $ | 39,509 |
|
Substantially all of these unrecognized tax benefits, if recognized, would impact the effective income tax rate. As of August 31, 2016, 2015 and 2014, the Company recognized $2.3 million, $1.8 million and $2.0 million, respectively for interest and penalties related to unrecognized tax benefits. The Company recognizes interest and penalties related to underpayment of income taxes as a component of income tax expense. With few exceptions, the Company is no longer subject to U.S. federal, state and foreign income tax examinations by tax authorities in major tax jurisdictions for years prior to fiscal 2006. The Company believes it is reasonably possible that the total amount of unrecognized tax benefits could decrease by up to $4.7 million within the next twelve months.
The Company’s policy is to remit earnings from foreign subsidiaries only to the extent the remittance does not result in an incremental U.S. tax liability. Accordingly, the Company does not currently provide for the additional U.S. and foreign income taxes which would become payable upon remission of undistributed earnings of foreign subsidiaries. Undistributed earnings on which additional income taxes have not been provided amounted to $302.4 million at August 31, 2016. If all such undistributed earnings were remitted, an additional income tax provision of $39.2 million would have been necessary as of August 31, 2016.
Earnings (loss) before income taxes from continuing operations, are summarized as follows (in thousands):
|
| | | | | | | | | | | |
| Year Ended August 31, |
| 2016 | | 2015 | | 2014 |
Domestic | $ | (19,182 | ) | | $ | 14,593 |
| | $ | 84,854 |
|
Foreign | (111,162 | ) | | 10,798 |
| | 89,172 |
|
| $ | (130,344 | ) | | $ | 25,391 |
| | $ | 174,026 |
|
Both domestic and foreign pre-tax earnings are impacted by changes in operating earnings, acquisition and divestiture activities, restructuring charges and the related benefits, growth investments, debt levels and the impact of changes in foreign currency exchange rates. In fiscal 2016, domestic earnings included a non-cash impairment charge of $49.0 million and a $5.1 million loss on the Sanlo divestiture while foreign earnings included a $137.5 million non-cash impairment charge. Fiscal 2015 domestic and foreign earnings were lower than the prior year, due to a non-cash impairment charge of $20.3 million and $64.1 million, respectively, while fiscal 2014 domestic earnings included a $13.5 million gain on the RV product line divestiture. Approximately 53%, 68% and 51% of pre-tax earnings (excluding impairment charges) were generated in foreign jurisdictions with tax rates lower than the U.S. federal income tax rate during fiscal 2016, 2015 and 2014, respectively.
Cash paid for income taxes, net of refunds totaled $21.4 million, 26.4 million, and $57.2 million (including tax due on divestitures) during the years ended August 31, 2016, 2015 and 2014, respectively.
ACTUANT CORPORATION
NOTES TO CONSOLIDATED FINANCIAL STATEMENTS—(Continued)
Note 11. Capital Stock and Share Repurchases
The authorized common stock of the Company as of August 31, 2016 consisted of 168,000,000 shares of Class A common stock, 0.20 par value, of which 79,393,393 shares were issued and 58,953,959 outstanding; 1,500,000 shares of Class B common stock, 0.20 par value, none of which were issued and outstanding; and 160,000 shares of cumulative preferred stock, 1.00 par value (“preferred stock”), none of which have been issued. Holders of both classes of the Company’s common stock are entitled to dividends, as the Company’s Board of Directors may declare out of funds legally available, subject to any contractual restrictions on the payment of dividends or other distributions on the common stock. If the Company were to issue any of its preferred stock, no dividends could be paid or set apart on shares of common stock, unless paid in common stock, until dividends on all of the issued and outstanding shares of preferred stock had been paid or set apart for payment and provision had been made for any mandatory sinking fund payments.
The Company's Board of Directors approved four separate authorizations (September 2011, March 2014, October 2014 and March 2015) to repurchase up to 7,000,000 shares each of the Company’s outstanding common stock. At August 31, 2016, cumulative shares repurchased totaled 20,439,434, leaving 7,560,566 shares authorized for future buy backs under these authorizations.
Earnings Per Share
The following table sets forth the computation of basic and diluted earnings (loss) per share (in thousands, except per share amounts): |
| | | | | | | | | | | |
| Year Ended August 31, |
| 2016 | | 2015 | | 2014 |
Numerator: | | | | | |
Net earnings (loss) | $ | (105,174 | ) | | $ | 19,872 |
| | $ | 163,573 |
|
Denominator: | | | | | |
Weighted average common shares outstanding - basic | 59,010 |
| | 61,262 |
| | 70,942 |
|
Net effect of dilutive securities - stock based compensation plans (1) | — |
| | 793 |
| | 1,544 |
|
Weighted average common shares outstanding - diluted | 59,010 |
| | 62,055 |
| | 72,486 |
|
| | | | | |
Basic Earnings (Loss) Per Share: | $ | (1.78 | ) | | $ | 0.32 |
| | $ | 2.31 |
|
Diluted Earnings (Loss) Per Share: | $ | (1.78 | ) | | $ | 0.32 |
| | $ | 2.26 |
|
| | | | | |
Anti-dilutive securities from stock based compensation plans (excluded from earnings per share calculation) | 4,832 |
| | 2,056 |
| | 522 |
|
(1) As a result of the impairment charges which caused a net loss in fiscal 2016, shares from stock based compensation plans are excluded from the calculation of diluted earnings (loss) per share, as the result would be anti-dilutive.
Note 12. Stock Plans
Stock options may be granted to key employees and directors under the Actuant Corporation 2009 Omnibus Incentive Plan (the “Plan”). At August 31, 2016, 9,400,000 shares of Class A common stock were authorized for issuance under the Plan, of which 1,935,182 shares were available for future award grants. The Plan permits the Company to grant share-based awards, including stock options, restricted stock and performance shares (the "Performance Shares") to employees and directors. Options generally have a maximum term of ten years, an exercise price equal to 100% of the fair market value of the Company’s common stock at the date of grant and generally vest 50% after three years and 100% after five years. The Company’s restricted stock grants generally have similar vesting provisions. The performance shares include a three-year performance period, with vesting based 50% on achievement of an absolute free cash flow conversion target and 50% on the Company’s total shareholder return ("TSR") relative to the S&P 600 SmallCap Industrial index. The provisions of share-based awards may vary by individual grant with respect to vesting period, dividend and voting rights, performance conditions and forfeitures.
ACTUANT CORPORATION
NOTES TO CONSOLIDATED FINANCIAL STATEMENTS—(Continued)
A summary of stock option activity during fiscal 2016 is as follows:
|
| | | | | | | | | | | | | |
| | Shares | | Weighted-Average
Exercise Price
(Per Share) | | Weighted-Average
Remaining Contractual
Term | | Aggregate
Intrinsic Value |
Outstanding on September 1, 2015 | | 3,852,663 |
| | $ | 24.47 |
| | | | |
Granted | | 445,093 |
| | 22.22 |
| | | | |
Exercised | | (175,950 | ) | | 20.27 |
| | | | |
Forfeited | | (643,744 | ) | | 26.85 |
| | | | |
Outstanding on August 31, 2016 | | 3,478,062 |
| | $ | 23.96 |
| | 4.8 | | $ | 6.3 | million |
Exercisable on August 31, 2016 | | 2,471,907 |
| | $ | 24.29 |
| | 3.2 | | $ | 4.6 | million |
Intrinsic value is the difference between the market value of the stock at August 31, 2016 and the exercise price which is aggregated for all options outstanding and exercisable. A summary of the weighted-average grant-date fair value of options, total intrinsic value of options exercised, and cash receipts from options exercised is summarized below (in thousands, except per share amounts):
|
| | | | | | | | | | | |
| Year Ended August 31, |
| 2016 | | 2015 | | 2014 |
Weighted-average fair value of options granted (per share) | $ | 8.63 |
| | $ | 8.35 |
| | $ | 14.46 |
|
Intrinsic value of options exercised | 989 |
| | 366 |
| | 16,380 |
|
Cash receipts from exercise of options | 3,564 |
| | 1,147 |
| | 22,423 |
|
A summary of restricted stock activity (including Performance Shares) during fiscal 2016 is as follows:
|
| | | | |
| Number of
Shares | | Weighted-Average Fair Value at Grant Date (Per Share) |
Outstanding on August 31, 2015 | 1,197,268 |
| | $28.13 |
Granted | 793,648 |
| | 22.64 |
Forfeited | (306,339 | ) | | 26.83 |
Vested | (331,072 | ) | | 28.25 |
Outstanding on August 31, 2016 | 1,353,505 |
| | 25.21 |
As of August 31, 2016, there was $24.8 million of total unrecognized compensation cost related to share-based awards, including stock options and restricted stock awards/units, which will be recognized over a weighted average period of 3.0 years. The total fair value of share-based awards that vested during the fiscal years ended August 31, 2016 and 2015 was $12.4 million and $14.2 million, respectively.
The Company generally records compensation expense over the vesting period for restricted stock awards based on the market value of Actuant common stock on the grant date. Stock based compensation expense is determined using a binomial pricing model for options. The fair value of Performance Shares with market vesting conditions is determined utilizing a Monte Carlo simulation model. Assumptions used to determine the fair value of each option were based upon historical data and standard industry valuation practices and methodology. The following weighted-average assumptions were used in each fiscal year:
|
| | | | | | | | |
| Fiscal Year Ended August 31, |
| 2016 | | 2015 | | 2014 |
Dividend yield | 0.19 | % | | 0.15 | % | | 0.11 | % |
Expected volatility | 38.06 | % | | 37.80 | % | | 38.30 | % |
Risk-free rate of return | 2.06 | % | | 1.19 | % | | 0.70 | % |
Expected forfeiture rate | 13 | % | | 14 | % | | 14 | % |
Expected life | 6.1 years |
| | 6.1 years |
| | 6.1 years |
|
ACTUANT CORPORATION
NOTES TO CONSOLIDATED FINANCIAL STATEMENTS—(Continued)
Note 13. Business Segment, Geographic and Customer Information
The Company is a global manufacturer of a broad range of industrial products and systems and is organized into three reportable segments: Industrial, Energy and Engineered Solutions. The Industrial segment is primarily involved in the design, manufacture and distribution of branded hydraulic and mechanical tools to the maintenance, industrial, infrastructure and production automation markets. The Energy segment provides joint integrity products and services, customized offshore vessel mooring solutions, as well as rope and cable solutions to the global oil & gas, power generation and other markets. The Engineered Solutions segment provides highly engineered position and motion control systems to original equipment manufacturers (“OEM”) in various on and off-highway vehicle markets, as well as a variety of other products to the industrial and agricultural markets.
The following tables summarize financial information by reportable segment and product line (in thousands):
|
| | | | | | | | | | | | |
| | Year Ended August 31, |
| | 2016 | | 2015 | | 2014 |
Net Sales by Reportable Product Line & Segment: | | | | | | |
Industrial Segment: | | | | | | |
Integrated Solutions | | $ | 44,985 |
| | $ | 47,294 |
| | $ | 52,962 |
|
Industrial Tools | | 314,832 |
| | 355,170 |
| | 360,940 |
|
| | 359,817 |
| | 402,464 |
| | 413,901 |
|
Energy Segment: | | | | | | |
Energy Maintenance & Integrity | | 278,881 |
| | 246,357 |
| | 267,500 |
|
Other Energy Services | | 113,849 |
| | 165,518 |
| | 194,869 |
|
| | 392,731 |
| | 411,875 |
| | 462,368 |
|
Engineered Solutions Segment: | | | | | | |
On-Highway | | 209,575 |
| | 220,889 |
| | 272,201 |
|
Agriculture, Off-Highway and Other | | 187,287 |
| | 214,026 |
| | 251,391 |
|
| | 396,862 |
| | 434,915 |
| | 523,592 |
|
| | $ | 1,149,410 |
| | $ | 1,249,254 |
| | $ | 1,399,862 |
|
| | | | | | |
Operating Profit (Loss): | |
|
| |
|
| |
|
|
Industrial | | $ | 79,773 |
| | $ | 105,652 |
| | $ | 120,250 |
|
Energy (1) | | (107,528 | ) | | (41,351 | ) | | 56,412 |
|
Engineered Solutions (2) | | (42,991 | ) | | 19,789 |
| | 55,430 |
|
Corporate | | (29,471 | ) | | (30,536 | ) | | (28,984 | ) |
| | $ | (100,217 | ) | | $ | 53,554 |
| | $ | 203,108 |
|
(1) Energy segment operating profit (loss) includes impairment charges of $140.9 million and $84.4 million in fiscal 2016 and 2015, respectively.
(2) Engineered Solutions segment operating profit (loss) includes an impairment charge of $45.7 million in fiscal 2016.
|
| | | | | | | | | | | | |
Depreciation and Amortization: | | | | | | |
Industrial | | $ | 8,175 |
| | $ | 8,257 |
| | $ | 7,597 |
|
Energy | | 21,944 |
| | 26,532 |
| | 33,983 |
|
Engineered Solutions | | 15,910 |
| | 16,652 |
| | 17,602 |
|
Corporate | | 1,749 |
| | 1,798 |
| | 1,453 |
|
| | $ | 47,777 |
| | $ | 53,239 |
| | $ | 60,635 |
|
| | | | | | |
Capital Expenditures | |
|
| |
|
| |
|
|
Industrial | | $ | 2,570 |
| | $ | 1,249 |
| | $ | 3,349 |
|
Energy | | 9,355 |
| | 11,864 |
| | 26,787 |
|
Engineered Solutions | | 5,974 |
| | 8,472 |
| | 8,763 |
|
Corporate | | 2,310 |
| | 931 |
| | 2,958 |
|
| | $ | 20,209 |
| | $ | 22,516 |
| | $ | 41,857 |
|
ACTUANT CORPORATION
NOTES TO CONSOLIDATED FINANCIAL STATEMENTS—(Continued)
|
| | | | | | | | |
| | August 31, |
| | 2016 | | 2015 |
Assets: | |
|
| |
|
|
Industrial | | $ | 308,222 |
| | $ | 293,738 |
|
Energy | | 479,169 |
| | 601,521 |
|
Engineered Solutions | | 493,840 |
| | 588,200 |
|
Corporate | | 161,307 |
| | 153,458 |
|
| | $ | 1,442,538 |
| | $ | 1,636,917 |
|
In addition to the impact of changes in foreign currency exchange rates, the comparability of segment and product line information is impacted by acquisition/divestiture activities, impairment charges, restructuring costs and related benefits. Corporate assets, which are not allocated, principally represent cash and cash equivalents, capitalized debt issuance costs and deferred income taxes.
The following tables summarize sales and long-lived assets (fixed assets and other long-term assets) by geographic region (in thousands):
|
| | | | | | | | | | | | |
| | Year Ended August 31, |
| | 2016 | | 2015 | | 2014 |
Net Sales: | |
|
| |
|
| |
|
|
United States | | $ | 477,670 |
| | $ | 526,061 |
| | $ | 573,590 |
|
Netherlands | | 143,517 |
| | 139,432 |
| | 151,549 |
|
United Kingdom | | 115,183 |
| | 113,743 |
| | 162,508 |
|
Australia | | 62,779 |
| | 94,319 |
| | 82,778 |
|
United Arab Emirates | | 55,906 |
| | 44,211 |
| | 18,101 |
|
All other | | 294,355 |
| | 331,488 |
| | 411,336 |
|
| | $ | 1,149,410 |
| | $ | 1,249,254 |
| | $ | 1,399,862 |
|
|
| | | | | | | | |
| | August 31, |
| | 2016 | | 2015 |
Long-lived Assets: | | | | |
United States | | $ | 32,205 |
| | $ | 41,645 |
|
China | | 16,863 |
| | 18,199 |
|
Australia | | 15,399 |
| | 15,227 |
|
United Kingdom | | 9,914 |
| | 21,704 |
|
United Arab Emirates | | 8,399 |
| | 1,104 |
|
All other | | 34,399 |
| | 47,183 |
|
| | $ | 117,179 |
| | $ | 145,062 |
|
The Company’s largest customer accounted for less than 3% of sales in each of the last three fiscal years. Export sales from domestic operations were approximately 6% of total net sales in each of the periods presented. In fiscal 2016, sales of products contributed approximately 80% of consolidated net sales, with the remaining revenue generated from engineering and technical manpower services, rental contracts and other sources. We provide certain Energy segment customers bundled products, services and rental assets. Further, our systems do not allocate costs between these sales categories. As a result, it is neither practical nor cost effective to disaggregate revenue and cost of sales separately for product sales, rental income and service revenue.
Note 14. Contingencies and Litigation
The Company had outstanding letters of credit of $17.8 million and $18.1 million at August 31, 2016 and 2015, respectively, the majority of which relate to commercial contracts and self-insured workers compensation programs.
The Company is a party to various legal proceedings that have arisen in the normal course of its business. These legal proceedings typically include product liability, environmental, labor, patent and other disputes. The Company has recorded reserves for loss contingencies based on the specific circumstances of each case. Such reserves are recorded when it is probable that a loss has been incurred and can be reasonably estimated. In the opinion of management, the resolution of these
ACTUANT CORPORATION
NOTES TO CONSOLIDATED FINANCIAL STATEMENTS—(Continued)
contingencies are not expected to have a material adverse effect on the Company’s financial condition, results of operations or cash flows.
The Company remains contingently liable for lease payments under leases of businesses that it previously divested or spun-off, in the event that such businesses are unable to fulfill their future lease payment obligations. The discounted present value of future minimum lease payments for these leases was $16.0 million at August 31, 2016 (including $12.3 million related to the former Electrical segment).
The Company has facilities in numerous geographic locations that are subject to a range of environmental laws and regulations. Environmental expenditures over the past three years have not been material. Management believes that such costs will not have a material adverse effect on the Company’s financial position, results of operations or cash flows.
Note 15. Guarantor Subsidiaries
On April 16, 2012, Actuant Corporation (the “Parent”) issued $300.0 million of 5.625% Senior Notes, of which $288.1 million remains outstanding as of August 31, 2016. All of our material domestic wholly owned subsidiaries (the “Guarantors”) fully and unconditionally guarantee the 5.625% Senior Notes on a joint and several basis. There are no significant restrictions on the ability of the Guarantors to make distributions to the Parent.
Certain assets, liabilities and expenses have not been allocated to the Guarantors and non-Guarantors and therefore are included in the Parent column in the accompanying consolidating financial statements. These items are of a corporate or consolidated nature and include, but are not limited to, tax provisions and related assets and liabilities, certain employee benefit obligations, prepaid and accrued insurance and corporate indebtedness. Intercompany activity in the consolidating financial statements primarily includes loan activity, purchases and sales of goods or services, investments and dividends. Intercompany balances also reflect certain non-cash transactions including transfers of assets and liabilities between the Parent, Guarantor and non-Guarantor, allocation of non-cash expenses from the Parent to the Guarantors and non-Guarantors, non-cash intercompany dividends and the impact of foreign currency rate changes.
During the fourth quarter of fiscal 2015 four non-guarantor wholly-owned subsidiaries were pledged as collateral under the debt agreement, which resulted in a change in entity status from non-guarantor to guarantor. This change was not properly reflected in the guarantor subsidiary footnote in fiscal 2015. In fiscal 2016, the Company corrected the classification of these entities as guarantors and all prior periods were recast to conform to the current guarantor structure. The impact of this change was to increase cash flow from operations of the guarantors by $12.3 million and $1.8 million in fiscal 2015 and 2014, respectively. This change had no impact on consolidated results of operations or financial position.
The following tables present the results of operations, financial position and cash flows of Actuant Corporation and its subsidiaries, the Guarantor and non-Guarantor entities, and the eliminations necessary to arrive at the information for the Company on a consolidated basis.
ACTUANT CORPORATION
NOTES TO CONSOLIDATED FINANCIAL STATEMENTS—(Continued)
CONDENSED CONSOLIDATING STATEMENTS OF OPERATIONS AND COMPREHENSIVE LOSS
(in thousands)
|
| | | | | | | | | | | | | | | | | | | | |
| | Year Ended August 31, 2016 |
| | Parent | | Guarantors | | Non-Guarantors | | Eliminations | | Consolidated |
Net sales | | $ | 135,679 |
| | $ | 361,209 |
| | $ | 652,522 |
| | $ | — |
| | $ | 1,149,410 |
|
Cost of products sold | | 34,576 |
| | 263,197 |
| | 448,240 |
| | — |
| | 746,013 |
|
Gross profit | | 101,103 |
| | 98,012 |
| | 204,282 |
| | — |
| | 403,397 |
|
Selling, administrative and engineering expenses | | 69,677 |
| | 69,382 |
| | 135,438 |
| | — |
| | 274,497 |
|
Restructuring charges | | 2,426 |
| | 3,455 |
| | 8,690 |
| | — |
| | 14,571 |
|
Amortization of intangible assets | | 1,272 |
| | 13,287 |
| | 8,384 |
| | — |
| | 22,943 |
|
Loss on product line divestiture | | — |
| | 5,092 |
| | — |
| | — |
| | 5,092 |
|
Impairment charges | | — |
| | 49,012 |
| | 137,499 |
| | — |
| | 186,511 |
|
Operating profit (loss) | | 27,728 |
| | (42,216 | ) | | (85,729 | ) | | — |
| | (100,217 | ) |
Financing costs, net | | 30,123 |
| | — |
| | (1,355 | ) | | — |
| | 28,768 |
|
Intercompany (income) expense, net | | (20,445 | ) | | (9,999 | ) | | 30,444 |
| | — |
| | — |
|
Intercompany dividends | | — |
| | — |
| | (5,338 | ) | | 5,338 |
| | — |
|
Other expense, net | | 914 |
| | 54 |
| | 391 |
| | — |
| | 1,359 |
|
Earnings (loss) before income taxes | | 17,136 |
| | (32,271 | ) | | (109,871 | ) | | (5,338 | ) | | (130,344 | ) |
Income tax expense (benefit) | | (8,729 | ) | | 519 |
| | (17,046 | ) | | 86 |
| | (25,170 | ) |
Net earnings (loss) before equity in earnings (loss) of subsidiaries | | 25,865 |
| | (32,790 | ) | | (92,825 | ) | | (5,424 | ) | | (105,174 | ) |
Equity in earnings (loss) of subsidiaries | | (131,037 | ) | | (83,747 | ) | | 3,024 |
| | 211,760 |
| | — |
|
Net loss | | (105,174 | ) | | (116,537 | ) | | (89,801 | ) | | 206,336 |
| | (105,174 | ) |
Comprehensive loss | | $ | (143,357 | ) | | $ | (157,344 | ) | | $ | (83,802 | ) | | $ | 241,146 |
| | $ | (143,357 | ) |
ACTUANT CORPORATION
NOTES TO CONSOLIDATED FINANCIAL STATEMENTS—(Continued)
CONDENSED CONSOLIDATING STATEMENTS OF OPERATIONS AND COMPREHENSIVE LOSS
(in thousands)
|
| | | | | | | | | | | | | | | | | | | | |
| | Year Ended August 31, 2015 |
| | Parent | | Guarantors | | Non-Guarantors | | Eliminations | | Consolidated |
Net sales | | $ | 158,836 |
| | $ | 385,476 |
| | $ | 704,942 |
| | $ | — |
| | $ | 1,249,254 |
|
Cost of products sold | | 40,858 |
| | 280,081 |
| | 466,474 |
| | — |
| | 787,413 |
|
Gross profit | | 117,978 |
| | 105,395 |
| | 238,468 |
| | — |
| | 461,841 |
|
Selling, administrative and engineering expenses | | 74,588 |
| | 69,041 |
| | 155,972 |
| | — |
| | 299,601 |
|
Impairment charges | | — |
| | 20,249 |
| | 64,104 |
| | — |
| | 84,353 |
|
Amortization of intangible assets | | 1,272 |
| | 13,061 |
| | 10,000 |
| | — |
| | 24,333 |
|
Operating profit | | 42,118 |
| | 3,044 |
| | 8,392 |
| | — |
| | 53,554 |
|
Financing costs, net | | 29,295 |
| | — |
| | (1,238 | ) | | — |
| | 28,057 |
|
Intercompany (income) expense, net | | (19,727 | ) | | (8,835 | ) | | 28,562 |
| | — |
| | — |
|
Intercompany dividends | | (212 | ) | | (243 | ) | | (10,707 | ) | | 11,162 |
| | — |
|
Other expense (income), net | | 160 |
| | (84 | ) | | 30 |
| | — |
| | 106 |
|
Earnings before income taxes | | 32,602 |
| | 12,206 |
| | (8,255 | ) | | (11,162 | ) | | 25,391 |
|
Income tax expense (benefit) | | (8,218 | ) | | 4,056 |
| | 10,939 |
| | (1,258 | ) | | 5,519 |
|
Net earnings (loss) before equity in earnings (loss) of subsidiaries | | 40,820 |
| | 8,150 |
| | (19,194 | ) | | (9,904 | ) | | 19,872 |
|
Equity in earnings (loss) of subsidiaries | | (20,948 | ) | | (1,720 | ) | | 6,520 |
| | 16,148 |
| | — |
|
Net earnings (loss) | | 19,872 |
| | 6,430 |
| | (12,674 | ) | | 6,244 |
| | 19,872 |
|
Comprehensive loss | | $ | (125,360 | ) | | $ | (10,689 | ) | | $ | (88,431 | ) | | $ | 99,120 |
| | $ | (125,360 | ) |
ACTUANT CORPORATION
NOTES TO CONSOLIDATED FINANCIAL STATEMENTS—(Continued)
CONDENSED CONSOLIDATING STATEMENTS OF EARNINGS AND COMPREHENSIVE INCOME
(in thousands)
|
| | | | | | | | | | | | | | | | | | | | |
| | Year Ended August 31, 2014 |
| | Parent | | Guarantors | | Non-Guarantors | | Eliminations | | Consolidated |
Net sales | | $ | 195,573 |
| | $ | 409,848 |
| | $ | 794,441 |
| | $ | — |
| | $ | 1,399,862 |
|
Cost of products sold | | 57,464 |
| | 290,840 |
| | 504,686 |
| | — |
| | 852,990 |
|
Gross profit | | 138,109 |
| | 119,008 |
| | 289,755 |
| | — |
| | 546,872 |
|
Selling, administrative and engineering expenses | | 96,220 |
| | 54,699 |
| | 181,174 |
| | — |
| | 332,093 |
|
Loss (gain) on product line divestiture | | 1,200 |
| | (14,695 | ) | | — |
| | — |
| | (13,495 | ) |
Amortization of intangible assets | | 1,272 |
| | 12,687 |
| | 11,207 |
| | — |
| | 25,166 |
|
Operating profit | | 39,417 |
| | 66,317 |
| | 97,374 |
| | — |
| | 203,108 |
|
Financing costs, net | | 25,611 |
| | 3 |
| | (569 | ) | | — |
| | 25,045 |
|
Intercompany (income) expense, net | | (27,601 | ) | | (5,760 | ) | | 33,361 |
| | — |
| | — |
|
Other expense (income), net | | 12,716 |
| | 153 |
| | (8,832 | ) | | — |
| | 4,037 |
|
Earnings from continuing operations before income taxes | | 28,691 |
| | 71,921 |
| | 73,414 |
| | — |
| | 174,026 |
|
Income tax expense (benefit) | | (16,529 | ) | | 33,690 |
| | 15,412 |
| | — |
| | 32,573 |
|
Net earnings from continuing operations before equity in earnings of subsidiaries | | 45,220 |
| | 38,231 |
| | 58,002 |
| | — |
| | 141,453 |
|
Equity in earnings of subsidiaries | | 139,865 |
| | 23,297 |
| | 15,058 |
| | (178,220 | ) | | — |
|
Earnings from continuing operations | | 185,085 |
| | 61,528 |
| | 73,060 |
| | (178,220 | ) | | 141,453 |
|
Earnings (loss) from discontinued operations | | (21,512 | ) | | 56,494 |
| | (12,862 | ) | | — |
| | 22,120 |
|
Net earnings | | 163,573 |
| | 118,022 |
| | 60,198 |
| | (178,220 | ) | | 163,573 |
|
Comprehensive income | | $ | 163,825 |
| | $ | 132,046 |
| | $ | 46,226 |
| | $ | (178,272 | ) | | $ | 163,825 |
|
ACTUANT CORPORATION
NOTES TO CONSOLIDATED FINANCIAL STATEMENTS—(Continued)
CONDENSED CONSOLIDATING BALANCE SHEETS
(in thousands)
|
| | | | | | | | | | | | | | | | | | | | |
| | August 31, 2016 |
| | Parent | | Guarantors | | Non-Guarantors | | Eliminations | | Consolidated |
ASSETS | | | | | | | | | | |
Current assets | | | | | | | | | | |
Cash and cash equivalents | | $ | 7,953 |
| | $ | 71 |
| | $ | 171,580 |
| | $ | — |
| | $ | 179,604 |
|
Accounts receivable, net | | 13,692 |
| | 41,715 |
| | 131,422 |
| | — |
| | 186,829 |
|
Inventories, net | | 19,897 |
| | 44,283 |
| | 66,576 |
| | — |
| | 130,756 |
|
Other current assets | | 7,754 |
| | 3,858 |
| | 33,851 |
| | — |
| | 45,463 |
|
Total current assets | | 49,296 |
| | 89,927 |
| | 403,429 |
| | — |
| | 542,652 |
|
Property, plant & equipment, net | | 5,927 |
| | 23,511 |
| | 84,577 |
| | — |
| | 114,015 |
|
Goodwill | | 38,847 |
| | 200,499 |
| | 279,930 |
| | — |
| | 519,276 |
|
Other intangibles, net | | 9,429 |
| | 149,757 |
| | 80,289 |
| | — |
| | 239,475 |
|
Investment in subsidiaries | | 1,915,367 |
| | 578,423 |
| | 465,736 |
| | (2,959,526 | ) | | — |
|
Intercompany receivable | | — |
| | 1,159,672 |
| | — |
| | (1,159,672 | ) | | — |
|
Other long-term assets | | 9,580 |
| | 10 |
| | 17,530 |
| | — |
| | 27,120 |
|
Total assets | | $ | 2,028,446 |
| | $ | 2,201,799 |
| | $ | 1,331,491 |
| | $ | (4,119,198 | ) | | $ | 1,442,538 |
|
| | | | | | | | | | |
LIABILITIES & SHAREHOLDERS' EQUITY | |
|
| |
|
| |
|
| | | |
|
|
Current liabilities | | | | | | | | | | |
Trade accounts payable | | $ | 11,529 |
| | $ | 20,669 |
| | $ | 82,853 |
| | $ | — |
| | $ | 115,051 |
|
Accrued compensation and benefits | | 17,506 |
| | 5,754 |
| | 23,641 |
| | — |
| | 46,901 |
|
Current maturities of debt and short-term borrowings | | 18,750 |
| | — |
| | — |
| | — |
| | 18,750 |
|
Income taxes payable | | 1,886 |
| | — |
| | 7,368 |
| | — |
| | 9,254 |
|
Other current liabilities | | 20,459 |
| | 6,989 |
| | 24,508 |
| | — |
| | 51,956 |
|
Total current liabilities | | 70,130 |
| | 33,412 |
| | 138,370 |
| | — |
| | 241,912 |
|
Long-term debt | | 565,559 |
| | — |
| | — |
| | — |
| | 565,559 |
|
Deferred income taxes | | 30,666 |
| | — |
| | 690 |
| | — |
| | 31,356 |
|
Pension and post-retirement benefit liabilities | | 16,803 |
| | — |
| | 8,864 |
| | — |
| | 25,667 |
|
Other long-term liabilities | | 47,739 |
| | 588 |
| | 8,767 |
| | — |
| | 57,094 |
|
Intercompany payable | | 776,599 |
| | — |
| | 383,073 |
| | (1,159,672 | ) | | — |
|
Shareholders’ equity | | 520,950 |
| | 2,167,799 |
| | 791,727 |
| | (2,959,526 | ) | | 520,950 |
|
Total liabilities and shareholders' equity | | $ | 2,028,446 |
| | $ | 2,201,799 |
| | $ | 1,331,491 |
| | $ | (4,119,198 | ) | | $ | 1,442,538 |
|
ACTUANT CORPORATION
NOTES TO CONSOLIDATED FINANCIAL STATEMENTS—(Continued)
CONDENSED CONSOLIDATING BALANCE SHEETS
(in thousands)
|
| | | | | | | | | | | | | | | | | | | | |
| | August 31, 2015 |
ASSETS | | Parent | | Guarantors | | Non-Guarantors | | Eliminations | | Consolidated |
Current assets | | | | | | | | | | |
Cash and cash equivalents | | $ | 18,688 |
| | $ | 567 |
| | $ | 149,591 |
| | $ | — |
| | $ | 168,846 |
|
Accounts receivable, net | | 16,135 |
| | 49,258 |
| | 127,688 |
| | — |
| | 193,081 |
|
Inventories, net | | 23,074 |
| | 55,151 |
| | 64,527 |
| | — |
| | 142,752 |
|
Deferred income taxes | | 9,256 |
| | — |
| | 3,666 |
| | — |
| | 12,922 |
|
Other current assets | | 18,020 |
| | 4,708 |
| | 20,060 |
| | — |
| | 42,788 |
|
Total current assets | | 85,173 |
| | 109,684 |
| | 365,532 |
| | — |
| | 560,389 |
|
Property, plant & equipment, net | | 6,363 |
| | 33,675 |
| | 102,420 |
| | — |
| | 142,458 |
|
Goodwill | | 38,847 |
| | 318,088 |
| | 251,321 |
| | — |
| | 608,256 |
|
Other intangibles, net | | 10,702 |
| | 173,497 |
| | 124,563 |
| | — |
| | 308,762 |
|
Investment in subsidiaries | | 2,067,438 |
| | 632,581 |
| | 182,001 |
| | (2,882,020 | ) | | — |
|
Intercompany receivable | | — |
| | 1,140,030 |
| | 45,141 |
| | (1,185,171 | ) | | — |
|
Other long-term assets | | 10,694 |
| | — |
| | 6,358 |
| | — |
| | 17,052 |
|
Total assets | | $ | 2,219,217 |
| | $ | 2,407,555 |
| | $ | 1,077,336 |
| | $ | (4,067,191 | ) | | $ | 1,636,917 |
|
| | | | | | | | | | |
LIABILITIES & SHAREHOLDERS' EQUITY | |
|
| |
|
| |
|
| |
|
| |
|
|
Current liabilities | | | | | | | | | | |
Trade accounts payable | | $ | 14,700 |
| | $ | 27,767 |
| | $ | 75,648 |
| | $ | — |
| | $ | 118,115 |
|
Accrued compensation and benefits | | 16,479 |
| | 3,625 |
| | 23,603 |
| | — |
| | 43,707 |
|
Income taxes payable | | 10,947 |
| | — |
| | 3,858 |
| | — |
| | 14,805 |
|
Current maturities of debt and short-term borrowings | | 3,750 |
| | — |
| | 219 |
| | — |
| | 3,969 |
|
Other current liabilities | | 19,817 |
| | 5,807 |
| | 28,836 |
| | — |
| | 54,460 |
|
Total current liabilities | | 65,693 |
| | 37,199 |
| | 132,164 |
| | — |
| | 235,056 |
|
Long-term debt | | 584,309 |
| | — |
| | — |
| | — |
| | 584,309 |
|
Deferred income taxes | | 43,210 |
| | — |
| | 29,731 |
| | — |
| | 72,941 |
|
Pension and post-retirement benefit liabilities | | 11,712 |
| | — |
| | 6,116 |
| | — |
| | 17,828 |
|
Other long-term liabilities | | 46,407 |
| | 400 |
| | 6,975 |
| | — |
| | 53,782 |
|
Intercompany payable | | 794,885 |
| | — |
| | 390,286 |
| | (1,185,171 | ) | | — |
|
Shareholders’ equity | | 673,001 |
| | 2,369,956 |
| | 512,064 |
| | (2,882,020 | ) | | 673,001 |
|
Total liabilities and shareholders’ equity | | $ | 2,219,217 |
| | $ | 2,407,555 |
| | $ | 1,077,336 |
| | $ | (4,067,191 | ) | | $ | 1,636,917 |
|
ACTUANT CORPORATION
NOTES TO CONSOLIDATED FINANCIAL STATEMENTS—(Continued)
CONDENSED CONSOLIDATING STATEMENTS OF CASH FLOWS
(in thousands)
|
| | | | | | | | | | | | | | | | | | | | |
| | Year Ended August 31, 2016 |
| | Parent | | Guarantors | | Non-Guarantors | | Eliminations | | Consolidated |
Operating Activities | |
| |
| |
| |
| |
|
Net cash provided by (used in) operating activities | | $ | 58,926 |
| | $ | (1,953 | ) | | $ | 66,062 |
| | $ | (5,338 | ) | | $ | 117,697 |
|
Investing Activities | | | | | | | | | | |
Capital expenditures | | (2,135 | ) | | (6,781 | ) | | (11,293 | ) | | — |
| | (20,209 | ) |
Proceeds from sale of property, plant and equipment | | 13 |
| | 7,000 |
| | 2,283 |
| | — |
| | 9,296 |
|
Intercompany investment | | (339 | ) | | (3,458 | ) | | — |
| | 3,797 |
| | — |
|
Business acquisitions, net of cash acquired | | — |
| | — |
| | (81,916 | ) | | — |
| | (81,916 | ) |
Proceeds from sale of businesses, net of transaction costs | | — |
| | 9,695 |
| | — |
| | — |
| | 9,695 |
|
Cash provided by (used in) investing activities | | (2,461 | ) | | 6,456 |
| | (90,926 | ) | | 3,797 |
| | (83,134 | ) |
Financing Activities | | | | | | | | | | |
Net repayments on revolving credit facility | | — |
| | — |
| | (210 | ) | | — |
| | (210 | ) |
Principal repayments on term loans | | (3,750 | ) | | — |
| | — |
| | — |
| | (3,750 | ) |
Purchase of treasury shares | | (17,101 | ) | | — |
| | — |
| | — |
| | (17,101 | ) |
Taxes paid related to the net share settlement of equity awards | | (1,409 | ) | | — |
| | — |
| | — |
| | (1,409 | ) |
Stock option exercises, related tax benefits, and other | | 6,416 |
| | — |
| | — |
| | — |
| | 6,416 |
|
Cash dividend | | (2,376 | ) | | (5,338 | ) | | — |
| | 5,338 |
| | (2,376 | ) |
Intercompany loan activity | | (48,980 | ) | | — |
| | 48,980 |
| | — |
| | — |
|
Intercompany capital contributions | | — |
| | 339 |
| | 3,458 |
| | (3,797 | ) | | — |
|
Cash provided by (used in) financing activities | | (67,200 | ) | | (4,999 | ) | | 52,228 |
| | 1,541 |
| | (18,430 | ) |
Effect of exchange rate changes on cash | | — |
| | — |
| | (5,375 | ) | | — |
| | (5,375 | ) |
Net increase (decrease) in cash and cash equivalents | | (10,735 | ) | | (496 | ) | | 21,989 |
| | — |
| | 10,758 |
|
Cash and cash equivalents—beginning of period | | 18,688 |
| | 567 |
| | 149,591 |
| | — |
| | 168,846 |
|
Cash and cash equivalents—end of period | | $ | 7,953 |
| | $ | 71 |
| | $ | 171,580 |
| | $ | — |
| | $ | 179,604 |
|
ACTUANT CORPORATION
NOTES TO CONSOLIDATED FINANCIAL STATEMENTS—(Continued)
CONDENSED CONSOLIDATING STATEMENTS OF CASH FLOWS
(in thousands)
|
| | | | | | | | | | | | | | | | | | | | |
| | Year Ended August 31, 2015 |
| | Parent | | Guarantors | | Non-Guarantors | | Eliminations | | Consolidated |
Operating Activities | | | | | | | | | | |
Net cash provided by (used in) operating activities | | $ | 90,632 |
| | $ | (20,750 | ) | | $ | 72,228 |
| | $ | (10,676 | ) | | $ | 131,434 |
|
Investing Activities | |
| |
| |
| |
| |
|
Capital expenditures | | (1,086 | ) | | (5,848 | ) | | (15,582 | ) | | — |
| | (22,516 | ) |
Proceeds from sale of property, plant and equipment | | — |
| | 273 |
| | 971 |
| | — |
| | 1,244 |
|
Intercompany investment | | (3,727 | ) | | — |
| | — |
| | 3,727 |
| | — |
|
Cash used in investing activities | | (4,813 | ) | | (5,575 | ) | | (14,611 | ) | | 3,727 |
| | (21,272 | ) |
Financing Activities | | | | | | | | | | |
Net borrowings on revolving credit facility | | — |
| | — |
| | 220 |
| | — |
| | 220 |
|
Principal repayment on term loan | | (3,375 | ) | | — |
| | — |
| | — |
| | (3,375 | ) |
Proceeds from term loans | | 213,375 |
| | — |
| | — |
| | — |
| | 213,375 |
|
Redemption on 5.625% Senior Notes | | (11,941 | ) | | — |
| | — |
| | — |
| | (11,941 | ) |
Debt issuance costs | | (2,025 | ) | | — |
| | — |
| | — |
| | (2,025 | ) |
Purchase of treasury shares | | (212,003 | ) | | — |
| | — |
| | — |
| | (212,003 | ) |
Taxes paid related to net share settlement of equity awards | | (2,466 | ) | | — |
| | — |
| | — |
| | (2,466 | ) |
Stock option exercises, related tax benefits and other | | 5,396 |
| | — |
| | — |
| | — |
| | 5,396 |
|
Cash dividend | | (2,598 | ) | | (10,676 | ) | | — |
| | 10,676 |
| | (2,598 | ) |
Intercompany loan activity | | (79,425 | ) | | 34,081 |
| | 45,344 |
| | — |
| | — |
|
Intercompany capital contributions | | — |
| | — |
| | 3,727 |
| | (3,727 | ) | | — |
|
Cash provided by (used in) financing activities | | (95,062 | ) | | 23,405 |
| | 49,291 |
| | 6,949 |
| | (15,417 | ) |
Effect of exchange rate changes on cash | | — |
| | — |
| | (34,911 | ) | | — |
| | (34,911 | ) |
Net increase (decrease) in cash and cash equivalents | | (9,243 | ) | | (2,920 | ) | | 71,997 |
| | — |
| | 59,834 |
|
Cash and cash equivalents—beginning of period | | 27,931 |
| | 3,487 |
| | 77,594 |
| | — |
| | 109,012 |
|
Cash and cash equivalents—end of period | | $ | 18,688 |
| | $ | 567 |
| | $ | 149,591 |
| | $ | — |
| | $ | 168,846 |
|
ACTUANT CORPORATION
NOTES TO CONSOLIDATED FINANCIAL STATEMENTS—(Continued)
CONDENSED CONSOLIDATING STATEMENTS OF CASH FLOWS
(in thousands)
|
| | | | | | | | | | | | | | | | | | | | |
| | Year Ended August 31, 2014 |
| | Parent | | Guarantors | | Non-Guarantors | | Eliminations | | Consolidated |
Operating Activities | | | | | | | | | | |
Net cash provided by (used in) operating activities | | $ | 76,870 |
| | $ | (19,156 | ) | | $ | 83,182 |
| | $ | (14,716 | ) | | $ | 126,180 |
|
Investing Activities | | | | | | | | | | |
Capital expenditures | | (4,498 | ) | | (6,397 | ) | | (30,962 | ) | | — |
| | (41,857 | ) |
Proceeds from sale of property, plant and equipment | | 85 |
| | 503 |
| | 43,686 |
| | — |
| | 44,274 |
|
Proceeds from sale of business | | (4,586 | ) | | 250,748 |
| | 43,428 |
| | — |
| | 289,590 |
|
Business acquisitions, net of cash acquired | | (30,500 | ) | | — |
| | — |
| | — |
| | (30,500 | ) |
Cash (used in) provided by investing activities | | (39,499 | ) | | 244,854 |
| | 56,152 |
| | — |
| | 261,507 |
|
Financing Activities | | | | | | | | | | |
Net repayments on revolving credit facility | | (125,000 | ) | | — |
| | — |
| | — |
| | (125,000 | ) |
Payment of deferred acquisition consideration | | — |
| | — |
| | (1,585 | ) | | — |
| | (1,585 | ) |
Purchase of treasury shares | | (283,712 | ) | | — |
| | — |
| | — |
| | (283,712 | ) |
Taxes paid related to net share settlement of equity awards | | (946 | ) | | — |
| | — |
| | — |
| | (946 | ) |
Stock option exercises, related tax benefits and other | | 32,224 |
| | — |
| | — |
| | — |
| | 32,224 |
|
Cash dividend | | (2,919 | ) | | — |
| | (14,716 | ) | | 14,716 |
| | (2,919 | ) |
Intercompany loan activity | | 354,791 |
| | (222,266 | ) | | (132,525 | ) | | — |
| | — |
|
Cash used in financing activities | | (25,562 | ) | | (222,266 | ) | | (148,826 | ) | | 14,716 |
| | (381,938 | ) |
Effect of exchange rate changes on cash | | — |
| | — |
| | (723 | ) | | — |
| | (723 | ) |
Net increase (decrease) in cash and cash equivalents | | 11,809 |
| | 3,432 |
| | (10,215 | ) | | — |
| | 5,026 |
|
Cash and cash equivalents—beginning of period | | 16,122 |
| | (107 | ) | | 87,971 |
| | — |
| | 103,986 |
|
Cash and cash equivalents—end of period | | $ | 27,931 |
| | $ | 3,325 |
| | $ | 77,756 |
| | $ | — |
| | $ | 109,012 |
|
ACTUANT CORPORATION
NOTES TO CONSOLIDATED FINANCIAL STATEMENTS—(Continued)
Note 16. Quarterly Financial Data (Unaudited)
Quarterly financial data for fiscal 2016 and fiscal 2015 is as follows:
|
| | | | | | | | | | | | | | | | | | | | |
| | Year Ended August 31, 2016 |
| | First | | Second | | Third | | Fourth | | Total |
Net sales | | $ | 305,011 |
| | $ | 263,289 |
| | $ | 305,341 |
| | $ | 275,769 |
| | $ | 1,149,410 |
|
Gross profit | | 108,562 |
| | 91,030 |
| | 107,526 |
| | 96,279 |
| | 403,397 |
|
Net earnings (loss) | | 15,448 |
| | (159,191 | ) | | 21,166 |
| | 17,402 |
| | (105,174 | ) |
Net earnings (loss) per share: | |
|
| |
|
| |
|
| |
|
| |
|
|
Basic | | $ | 0.26 |
| | $ | (2.70 | ) | | $ | 0.36 |
| | $ | 0.30 |
| | $ | (1.78 | ) |
Diluted | | 0.26 |
| | (2.70 | ) | | 0.36 |
| | 0.29 |
| | (1.78 | ) |
| | | | | | | | | | |
| | Year Ended August 31, 2015 |
| | First | | Second | | Third | | Fourth | | Total |
Net sales | | $ | 327,765 |
| | $ | 301,005 |
| | $ | 320,100 |
| | $ | 300,384 |
| | $ | 1,249,254 |
|
Gross profit | | 126,976 |
| | 109,763 |
| | 118,560 |
| | 106,542 |
| | 461,841 |
|
Net earnings (loss) | | 24,674 |
| | (64,838 | ) | | 37,958 |
| | 22,078 |
| | 19,872 |
|
Net earnings (loss) per share: | |
|
| |
|
| |
|
| |
|
| |
|
|
Basic | | $ | 0.38 |
| | $ | (1.05 | ) | | $ | 0.64 |
| | $ | 0.37 |
| | $ | 0.32 |
|
Diluted | | 0.38 |
| | (1.05 | ) | | 0.63 |
| | 0.37 |
| | 0.32 |
|
The sum of the quarters may not equal the total of the respective year’s earnings per share on either a basic or diluted basis due to changes in the weighted average shares outstanding during the year.
During the second quarters of fiscal 2016 and 2015 the Company recognized impairment charges of $186.5 million and $84.4 million, respectively (see Note 4, "Goodwill, Intangible Assets and Long-Lived Assets").
ACTUANT CORPORATION
SCHEDULE II—VALUATION AND QUALIFYING ACCOUNTS
(in thousands)
|
| | | | | | | | | | | | | | | | | | | | | | | | |
| | | | Additions | | Deductions | | | | |
| | Balance at
Beginning of
Period | | Charged to
Costs and
Expenses | | Acquisition/ (Divestiture) | | Accounts
Written Off
Less
Recoveries | | Other | | Balance at
End of
Period |
| | | | | | | | | | | | |
Allowance for losses—Trade accounts receivable | | | | | | | | |
August 31, 2016 | | $ | 3,970 |
| | $ | 2,274 |
| | $ | 3,090 |
| | $ | (1,580 | ) | | $ | 8 |
| | $ | 7,762 |
|
August 31, 2015 | | 6,034 |
| | 1,633 |
| | — |
| | (2,742 | ) | | (955 | ) | | 3,970 |
|
August 31, 2014 | | 3,701 |
| | 2,447 |
| | 440 |
| | (664 | ) | | 110 |
| | 6,034 |
|
| | | | | | | | | | | | |
Valuation allowance—Income taxes | | | | | | | | | | |
August 31, 2016 | | $ | 8,053 |
| | $ | 852 |
| | $ | — |
| | $ | (1,026 | ) | | $ | 268 |
| | $ | 8,147 |
|
August 31, 2015 | | 5,608 |
| | 5,694 |
| | — |
| | (2,254 | ) | | (995 | ) | | 8,053 |
|
August 31, 2014 | | 17,268 |
| | 1,243 |
| | (5,487 | ) | | (6,936 | ) | | (480 | ) | | 5,608 |
|
Item 9. Changes in and Disagreements with Accountants on Accounting and Financial Disclosure
None.
Item 9A. Controls and Procedures
Disclosure Controls and Procedures
The Company’s management, with the participation of the Company’s Chief Executive Officer and Chief Financial Officer, have evaluated the effectiveness of the Company’s disclosure controls and procedures (as such term is defined in Rules 13a-15(e) and 15d-15(e) under the Securities Exchange Act of 1934, as amended (“the Exchange Act”)) as of the end of the period covered by this report. Based on such evaluation, the Company’s Chief Executive Officer and Chief Financial Officer have concluded that, as of the end of such period, the Company’s disclosure controls and procedures are effective in recording, processing, summarizing, and reporting, on a timely basis, information required to be disclosed by the Company in the reports that it files or submits under the Exchange Act, and that information is accumulated and communicated to the Chief Executive Officer and Chief Financial Officer, as appropriate, to allow timely discussions regarding required disclosure.
Management’s Report on Internal Control Over Financial Reporting
The Company’s management is responsible for establishing and maintaining adequate internal control over financial reporting, as such term is defined in Exchange Act Rule 13a-15(f). The Company’s management, with the participation of the Company’s Chief Executive Officer and Chief Financial Officer, has evaluated the effectiveness of the Company’s internal control over financial reporting based on the framework in Internal Control-Integrated Framework (2013) issued by the Committee of Sponsoring Organizations of the Treadway Commission. Based on this evaluation, the Company’s management has concluded that, as of August 31, 2016, the Company’s internal control over financial reporting was effective.
Because of its inherent limitations, internal control over financial reporting may not prevent or detect misstatements. Also, projections of any evaluation of the effectiveness to future periods are subject to the risk that the controls may become inadequate because of changes in conditions, or that the degree of compliance with the policies or procedures may deteriorate.
Management has excluded certain elements of acquired businesses, Larzep and Pipeline and Process Services (collectively “the Acquired Businesses”), from its assessment of internal control over financial reporting as of August 31, 2016 because the businesses were acquired by the Company in a purchase business combination during fiscal 2016. Subsequent to the acquisition, certain elements of the Acquired Businesses’ internal control over financial reporting and related processes were integrated into the Company existing systems and internal control over financial reporting. Those controls that were not integrated have been excluded from management’s assessment of the effectiveness of internal control over finical reporting as of August 31, 2016. The Acquired Businesses are wholly-owned subsidiaries of the Company whose total assets and total revenues represent less than 7% and less than 2%, respectively, of the related consolidated financial statement amounts as of and for the year ended August 31, 2016.
PricewaterhouseCoopers LLP, an independent registered public accounting firm, has audited the Company’s effectiveness of internal controls over financial reporting as of August 31, 2016, as stated in their report which is included herein.
Changes in Internal Control Over Financial Reporting
There were no changes in the Company’s internal control over financial reporting during the fourth quarter of fiscal 2016 that materially affected, or are reasonably likely to materially affect, the Company’s internal control over financial reporting.
Item 9B. Other Information
None.
PART III
Item 10. Directors; Executive Officers and Corporate Governance
Information about the Company’s directors is incorporated by reference from the “Election of Directors” section of the Company’s Proxy Statement for its Annual Meeting of Shareholders to be held on January 17, 2017 (the “2017 Annual Meeting Proxy Statement”). Information about compliance with Section 16(a) of the Exchange Act is incorporated by reference from the “Other Information—Section 16(a) Beneficial Ownership Reporting Compliance” section in the Company’s 2017 Annual Meeting Proxy Statement. Information about the Company’s Audit Committee, including the members of the committee, and the Company’s Audit Committee financial experts, is incorporated by reference from the “Election of Directors” and “Corporate Governance Matters” sections of the Company’s 2017 Annual Meeting Proxy Statement. Information about the Company’s executive officers required by this item is contained in the discussion entitled “Executive Officers of the Registrant” in Part I hereof.
The Company has adopted a code of ethics that applies to its senior executive team, including its chief executive officer, chief financial officer and corporate controller. The code of ethics is posted on the Company’s website and is available free of charge at www.actuant.com. The Company intends to satisfy the requirements under Item 5.05 of Form 8-K regarding disclosure of amendments to, or waivers from, provisions of its code of ethics that apply to the Chief Executive Officer, Chief Financial Officer or Corporate Controller by posting such information on the Company’s website.
Item 11. Executive Compensation
The information required by this item is incorporated by reference from the “Election of Directors,” “Corporate Governance Matters” and the “Executive Compensation” sections (other than the subsection thereof entitled “Report of the Audit Committee”) of the 2017 Annual Meeting Proxy Statement.
Item 12. Security Ownership of Certain Beneficial Owners and Management and Related Stockholder Matters
The information required by this item is incorporated by reference from the “Certain Beneficial Owners” and “Executive Compensation—Equity Compensation Plan Information” sections of the 2017 Annual Meeting Proxy Statement.
Item 13. Certain Relationships and Related Transactions, and Director Independence
The information required by this item is incorporated by reference from the “Certain Relationships and Related Party Transactions” section of the 2017 Annual Meeting Proxy Statement.
Item 14. Principal Accountant Fees and Services
The information required by this item is incorporated by reference from the “Other Information—Independent Public Accountants” section of the 2017 Annual Meeting Proxy Statement.
PART IV
Item 15. Exhibits, Financial Statement Schedules
(a) Documents filed as part of this report:
1. Consolidated Financial Statements
See “Index to Consolidated Financial Statements” set forth in Item 8, “Financial Statements and Supplementary Data” for a list of financial statements filed as part of this report.
2. Financial Statement Schedules
See “Index to Financial Statement Schedule” set forth in Item 8, “Financial Statements and Supplementary Data.”
3. Exhibits
See “Index to Exhibits” beginning on page 67, which is incorporated herein by reference.
SIGNATURES
Pursuant to the requirements of Section 13 or 15(d) of the Securities Exchange Act of 1934, the Registrant has duly caused this report to be signed on its behalf by the undersigned, thereunto duly authorized.
|
| | |
| ACTUANT CORPORATION (Registrant) |
| | |
| By: | /S/ ANDREW G. LAMPEREUR |
| | Andrew G. Lampereur |
| | Executive Vice President and Chief Financial Officer |
| | (Principal Financial Officer) |
Dated: October 26, 2016
POWER OF ATTORNEY
KNOWN ALL MEN BY THESE PRESENTS, that each person whose signature appears below constitutes and appoints Randal W. Baker and Andrew G. Lampereur, and each of them, his true and lawful attorneys-in-fact and agents, with full power of substitution and resubstitution, for him and in his name, place and stead, in any and all capacities, to sign any and all amendments to this report, and to file the same, with all and any other regulatory authority, granting unto said attorneys-in-fact and agents, and each of them, full power and authority to do and perform each and every act and thing requisite and necessary to be done in and about the premises, as fully to all intents and purposes as he might or could do in person, hereby ratifying and confirming all that said attorneys-in-fact and agents or any of them, or their substitutes, may lawfully do or cause to be done by virtue hereof.
Pursuant to the requirements of the Securities Exchange Act of 1934, this report has been signed below by the following persons on behalf of the registrant and in the capacities and on the dates indicated.* |
| | |
Signature | | Title |
| |
/s/ RANDAL W. BAKER | | President and Chief Executive Officer |
Randal W. Baker | | |
| | |
/s/ ROBERT C. ARZBAECHER | | Director |
Robert C. Arzbaecher | |
| | |
/s/ GURMINDER S. BEDI | | Director |
Gurminder S. Bedi | | |
| |
/s/ DANNY L. CUNNINGHAM | | Director |
Danny L. Cunningham | | |
| | |
/s/ E. JAMES FERLAND | | Director |
E. James Ferland | | |
| |
/s/ THOMAS J. FISCHER | | Director |
Thomas. J. Fischer | | |
| |
/s/ R. ALAN HUNTER, JR | | Director |
R. Alan Hunter, Jr. | | |
| | |
/s/ ROBERT A. PETERSON | | Chairman of the Board of Directors |
Robert A. Peterson | | |
| |
/s/ DENNIS K. WILLIAMS | | Director |
Dennis K. Williams | | |
| |
/s/ HOLLY A. VANDEURSEN | | Director |
Holly A. VanDeursen | | |
| | |
/s/ ANDREW G. LAMPEREUR | | Executive Vice President and Chief Financial Officer (Principal Financial Officer) |
Andrew G. Lampereur | | |
| |
/s/ MATTHEW P. PAULI | | Corporate Controller and Principal Accounting Officer |
Matthew P. Pauli | | |
* Each of the above signatures is affixed as of October 26, 2016.
ACTUANT CORPORATION
(the “Registrant”)
(Commission File No. 1-11288)
ANNUAL REPORT ON FORM 10-K
FOR THE FISCAL YEAR ENDED AUGUST 31, 2016
INDEX TO EXHIBITS
|
| | | | | | | | | |
Exhibit | | Description | | Incorporated Herein By Reference To | | Filed Herewith | | Furnished Herewith |
3.1 |
| | (a) Amended and Restated Articles of Incorporation | | Exhibit 4.9 to the Registrant's Form 10-Q for the quarter ended February 28, 2001 | | | | |
| | | | | | | | |
| | (b) Amendment to Amended and Restated Articles of Incorporation | | Exhibit 3.1(b) of the Registrant's Form 10-K for the fiscal year ended August 31, 2003 | | | | |
| | | | | | | | |
| | (c) Amendment to Amended and Restated Articles of Incorporation | | Exhibit 3.1 to the Registrant's Form 10-K for the fiscal year ended August 31, 2004 | | | | |
| | | | | | | | |
| | (d) Amendment to Amended and Restated Articles of Incorporation | | Exhibit 3.1 to the Registrant's Form 8-K filed on July 18, 2006 | | | | |
| | | | | | | | |
| | (e) Amendment of Amended and Restated Articles of Incorporation | | Exhibit 3.1 to the Registrant's Form 8-K filed on January 14, 2010 | | | | |
| | | | | | | | |
3.2 |
| | Amended and Restated Bylaws, as amended | | Exhibit 3.1 of the Registrant's Form 8-K filed on July 23, 2015 | | | | |
| | | | | | | | |
4.1 |
| | Indenture dated April 16, 2012 by and among Actuant Corporation, the subsidiary guarantors named therein and U.S. Bank National Association as trustee relating to $300 million Actuant Corporation 5 5/8% Senior Notes due 2022 | | Exhibit 4.1 to the Registrant's Current Report on Form 8-K filed on April 18, 2012 | | | | |
| | | | | | | | |
4.2 |
| | Fifth Amended and Restated Credit Agreement dated May 8, 2015 among Actuant Corporation, the Lenders party thereto and JP Morgan Chase, N.A. as the agent | | Exhibit 10.1 to the Registrant's Form 10-Q for the quarter ended May 31, 2015 | | | | |
| | | | | | | | |
10.1 |
| | Outside Directors’ Deferred Compensation Plan (conformed through the second amendment) | | Exhibit 10.1 to the Registrant's Form 10-Q for the quarter ended November 30, 2014 | | | | |
| | | | | | | | |
|
| | | | | | | | | |
Exhibit | | Description | | Incorporated Herein By Reference To | | Filed
Herewith | | Furnished Herewith |
10.2 |
| | Actuant Corporation Deferred Compensation Plan (conformed through the fourth amendment) | | Exhibit 10.2 to the Registrant's Form 10-Q for the quarter ended November 30, 2014 | | | | |
| | | | | | | | |
10.3 |
| | Actuant Corporation 2010 Employee Stock Purchase Plan | | Exhibit B to the Registrant's Proxy Statement, dated December 4, 2009 | | | | |
| | | | | | | | |
10.4 |
| | Actuant Corporation 2009 Omnibus Incentive Plan, conformed through the Second Amendment thereto | | Exhibit 99.1 to the Registrant's Form 8-K filed on January 17, 2013 | | | | |
| | | | | | | | |
10.5 |
| | (a) Actuant Corporation 2001 Outside Directors’ Stock Plan | | Exhibit A to the Registrant's Proxy Statement, dated December 5, 2005 for the 2006 Annual Meeting of Shareholders | | | | |
| | | | | | | | |
| | (b) First Amendment to the Amended and Restated Actuant Corporation 2001 Outside Directors’ Stock Plan dated December 25, 2008 | | Exhibit 10.10 to the Registrant's Form 10-Q for the quarter ended November 30, 2008 | | | | |
| | | | | | | | |
10.6 |
| | Actuant Corporation Supplemental Executive Retirement Plan (conformed through the first amendment) | | Exhibit 10.3 to the Registrant's Form 10-Q for the quarter ended November 30, 2014 | | | | |
| | | | | | | | |
10.7 |
| | Form of Indemnification Agreement for Directors and Officers | | Exhibit 10.35 to the Registrant's Form 10-K for the fiscal year ended August 31, 2002 | | | | |
| | | | | | | | |
10.8 |
| | Form of Actuant Corporation Change in Control Agreement for Executive Officers | | Exhibit 10.1 to the Registrant's Form 8-K filed on May 2, 2012 | | | | |
| | | | | | | | |
10.9 |
| | Actuant Corporation Executive Officer Bonus Plan | | Exhibit B to the Registrant's Definitive Proxy statement dated December 3, 2012 | | | | |
| | | | | | | | |
10.10 |
| | (a) Form of NQSO Award (Director) under Actuant Corporation 2009 Omnibus Incentive Plan | | Exhibit 10.1(a) to the Registrant's Form 10-Q for the quarter ended February 28, 2014 | | | | |
| | | | | | | | |
| | (b) Form of NQSO Award (Officer) under Actuant Corporation 2009 Omnibus Incentive Plan | | Exhibit 10.1(b) to the Registrant's Form 10-Q for the quarter ended February 28, 2014 | | | | |
|
| | | | | | | | | |
Exhibit | | Description | | Incorporated Herein By Reference To | | Filed
Herewith | | Furnished Herewith |
10.11 |
| | (a) Form RSA Award (Director) under Actuant 2009 Omnibus Incentive Plan | | Exhibit 10.2(a) to the Registrant's Form 10-Q for the quarter ended February 28, 2014 | | | | |
| | | | | | | | |
| | (b) Form of RSA Award (Officer) under Actuant Corporation 2009 Omnibus Incentive Plan | | Exhibit 10.2(b) to the Registrant's Form 10-Q for the quarter ended February 28, 2014 | | | | |
| | | | | | | | |
10.12 |
| | (a) Form of RSU Award (Director) under Actuant Corporation 2009 Omnibus Incentive Plan | | Exhibit 10.3(a) to the Registrant's Form 10-Q for the quarter ended February 28, 2014 | | | | |
| | | | | | | | |
| | (b) Form of RSU Award (Officer) under Actuant Corporation 2009 Omnibus Incentive Plan | | Exhibit 10.3(b) to the Registrant's Form 10-Q for the quarter ended February 28, 2014 | | | | |
| | | | | | | | |
10.13 |
| | Offer Letter dated August 24, 2015 by and between Actuant Corporation and Robert C. Arzbaecher | | Exhibit 10.1 to the Registrant's Form 8-K filed on August 25, 2015 | | | | |
| | | | | | | | |
10.14 |
| | Separation and Release Agreement dated August 24, 2015 by and between Actuant Corporation and Mark E. Goldstein | | Exhibit 10.3 to the Registrant's Form 8-K filed on August 25, 2015 | | | | |
| | | | | | | | |
10.15 |
| | Offer letter dated February 24, 2016 between Actuant Corporation and Randal W. Baker | | Exhibit 10.1 to the Registrant's Form 8-K filed on March 1, 2016 | | | | |
| | | | | | | | |
10.16 |
| | Separation and Release Agreement dated September 7, 2016 by and between Actuant Corporation and David (Mark) Sefcik | | | | X | | |
| | | | | | | | |
10.17 |
| | Retirement Agreement by and between Actuant Corporation and Eugene E. Skogg | | | | X | | |
| | | | | | | | |
14 |
| | Code of Ethics Applicable to Senior Financial Executives | | Exhibit 14 of the Registrant's Form 10-K for the fiscal year ended August 31, 2003 | | | | |
| | | | | | | | |
21 |
| | Subsidiaries of the Registrant | | | | X | | |
| | | | | | | | |
23 |
| | Consent of PricewaterhouseCoopers LLP | | | | X | | |
|
| | | | | | | | | |
Exhibit | | Description | | Incorporated Herein By Reference To | | Filed
Herewith | | Furnished Herewith |
24 |
| | Power of Attorney | | | | See signature page of this report | | |
| | | | | | | | |
31.1 |
| | Certification of Chief Executive Officer pursuant to Section 302 of the Sarbanes-Oxley Act of 2002 | | | | X | | |
| | | | | | | | |
31.2 |
| | Certification of Chief Financial Officer pursuant to Section 302 of the Sarbanes-Oxley Act of 2002 | | | | X | | |
| | | | | | | | |
32.1 |
| | Certification of Chief Executive Officer pursuant to Section 906 of the Sarbanes-Oxley Act of 2002 | | | | | | X |
| | | | | | | | |
32.2 |
| | Certification of Chief Financial Officer pursuant to Section 906 of the Sarbanes-Oxley Act of 2002 | | | | | | X |
|
|
|
|
|
|
|
|
|
101 |
| | The following materials from the Actuant Corporation Form 10-K for the year ended August 31, 2016 formatted in Extensible Business Reporting Language (XBRL): (i) the Consolidated Statements of Operations, (ii) the Consolidated Statements of Comprehensive Income (Loss), (iii) the Consolidated Balance Sheets, (iv) the Consolidated Statements of Cash Flows and (v) the Notes to Consolidated Financial Statements. | | | | X | | |